
The S-1’s operating data points to strong demand. Revenue rose from $2.0 billion in Q4 2025 to $11.6 billion in Q2 2026, and implied Q3 2026 revenue, which the S-1 does not report, is roughly $16.7 billion. One indicator of that demand is growth in large customers; those spending $100,000 or more a year roughly doubled in a single quarter to 11,900 in Q3 and more than 1,900 now spend $1 million or more. More than half of large customers now use both the Claude Platform and at least one first-party application, up from ~30% at the end of 2025, and no single customer accounted for more than 10% of revenue in the nine months through September.
The pace of growth is slowing: Q3’s roughly 44% sequential growth compares with 144% in Q2, although prior quarters grew from much smaller bases. Management also estimates that 5% to 7% of revenue in the nine months through September came from customers later found to have violated its usage policy or commercial terms. However, revenue has grown faster than compute costs, and Q2 2026 was the first quarter reported in the S-1 with positive GAAP and adjusted operating profits (8% and 19% margins, respectively). A GAAP net loss of $80.7 billion in H1 2026 drew headlines but is largely explained by a $72.4 billion non-cash charge from a change in the fair value of convertible notes, derivatives and SAFEs. The open question is whether margins hold as growth decelerates, stock compensation steps up after the IPO, and committed compute capacity comes online (Anthropic has almost $590 billion of compute commitments).
This piece walks through both sides using Daloopa’s newly published dataset for Anthropic, built from the S-1. We used the same data to build a full financial model, which surfaced several details that are easy to miss on a first read of the filing.
Key demand signals
Large customers have grown in number. Customers spending $100,000 or more rose from about 950 a year earlier to 11,900, and about 250 now spend $10 million or more. Customers spending $100,000 or more have roughly doubled from Q2 2026 to Q3 2026.
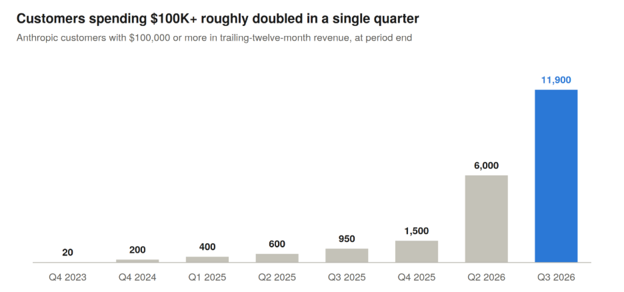
Source: Daloopa (Anthropic S-1 KPIs). Q1 2026 not disclosed.
Cross-product adoption is rising. More than half of customers spending $100,000 or more now use both the Claude Platform and at least one first-party application, such as Claude Code or Claude Cowork, up from ~30% at the end of 2025. Because the large-customer base grew so quickly over the same period, the absolute shift is bigger than the percentages suggest: over 5,950 multi-product customers today, compared with about 450 nine months earlier. Customers that build on the platform and deploy Anthropic’s own applications are embedding Claude in more workflows and teams. The S-1 does not break out revenue by product, so it does not yet show how much each product contributes to that spend.
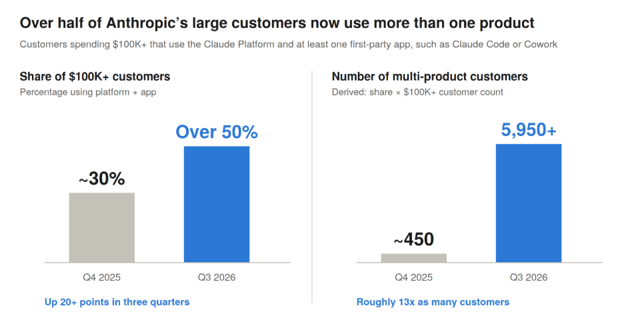
Source: Daloopa (Anthropic S-1 KPIs). Counts are derived from rounded company figures: 30% × 1,500 $100K+ customers at Q4 2025; over 50% × 11,900 at Q3 2026. The S-1 does not disclose revenue by product, or how much of each customer’s spend comes from each product.
Customer concentration has fallen sharply. In 2023, a single customer accounted for 43% of revenue. In the first half of 2026, the largest disclosed customer accounted for 11%, and for the nine months through September no single customer exceeded 10%. Revenue from customers outside the top five rose from 64% in Q1 2026 to 79% in Q3.
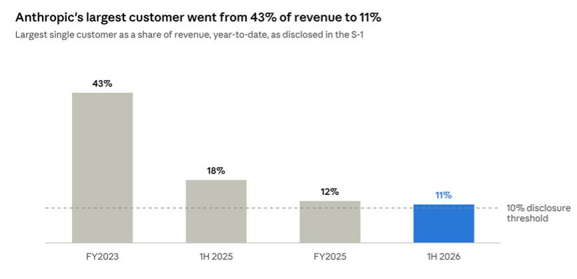
Source: Daloopa (Anthropic S-1, customers at ≥10% of revenue). Customers are not named; the S-1 labels the 2023 and 1H 2026 figures as the same customer. No customer reached 10% of revenue in 2024.
Margins improved as revenue grew faster than compute
Revenue at this scale has also changed the cost picture, with compute (Anthropic’s largest cost, covering model training, research and serving customers) falling sharply as a percentage of revenue. Between Q4 2025 and Q2 2026, revenue grew 5.7x while compute and infrastructure expense grew 1.9x, from $2.9 billion to $5.6 billion. Compute went from 144% of revenue to 48%.
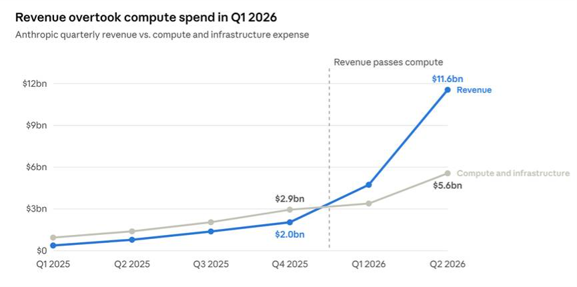
Source: Anthropic S-1 via Daloopa data sheet
Revenue rose 144% sequentially in Q2 2026, from $4.7 billion to $11.6 billion. Implied Q3 2026 revenue of ~$16.7 billion (trailing-twelve-month revenue per employee of $6.6 million and headcount of 5,300 as of September 30) suggests ~44% sequential growth, a deceleration from Q2.
The emerging gap between revenue and compute and infrastructure expense accompanied margin expansion. Adjusted operating margin went from (84)% in Q4 2025 to (13)% in Q1 2026 and 19% in Q2 2026, when adjusted operating income reached $2.2 billion. On a GAAP basis, Q2 produced $974 million of operating income for an 8% operating margin, the first positive quarter of the six the filing covers.
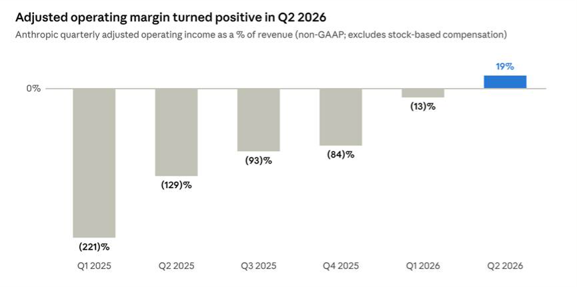
Source: Daloopa (Anthropic S-1, GAAP to non-GAAP reconciliation)
The S-1 attributes the improvement to compute efficiency, noting that Q2 revenue grew 1,368% year over year while compute expense grew 300%. It also says Claude Opus 5.5 cut customers’ cost per task by about 40% compared with Opus 5 while preserving Anthropic’s margins. The filing doesn’t separate how much of that came from lower prices, fewer tokens per task or a shift toward cheaper models.
Stock-based compensation, margins, and long-term spending
Three considerations bear on whether Q2’s margins can be sustained. First, while adjusted figures are useful for seeing through one-time and non-cash items, they exclude one cost that is real for shareholders: stock-based compensation (SBC). In Q2 2026, SBC was $1.3 billion, or 11% of revenue. It is the reason GAAP operating margin was 8% rather than 19%.
That expense is set to rise. Many employee RSUs vest only on a liquidity event, so their cost has not yet been recognized. The S-1 says completing the offering on June 30 would have triggered $2.9 billion of catch-up expense, with a further $23.7 billion to be recognized over a weighted average of about two years. This expense is paid in dilution rather than cash, but it can outweigh today’s operating profit.
Second, a supplemental note to the financial statements groups the same operating expenses by function rather than by type of cost, which largely separates the cost of serving customers from the cost of building future models. On that basis, cost of revenue was $2.4 billion in the first half of 2026 against $16.3 billion of revenue, an implied gross margin of about 85%. Research and development, which covers compute for model development, research, and Anthropic’s internal use of Claude, was $9.7 billion, or 60% of revenue, down from 159% of revenue in H1 2025 but still exceeding every other cost category.
Gross margin on this implied basis has improved sharply over the past year, from about 12% in the first half of 2025 to about 40% for full-year 2025 and 85% in the first half of 2026. Two caveats apply. Channel-partner costs and the compute behind free access sit in sales and marketing, so 85% is not an all-in serving margin. And model versions released in the six months to September accounted for more than 80% of Q3 revenue, which the company says makes ongoing model development critical to revenue. Although it is not directly mentioned in the S-1, it can be inferred that much of that R&D is the recurring cost of staying competitive rather than optional investment.
Third, the current operating margin gains now have to hold against growing long-term spending commitments. The S-1 discloses nearly $590 billion of purchase commitments and signed leases for compute, and details on the year-by-year payment schedule are currently blank in the S-1.
A final point on the GAAP net loss and cash flow
About $72.4 billion of Anthropic’s H1 2026 GAAP net loss was due to a change in fair value of convertible notes, derivative liabilities and SAFEs. As Anthropic’s private valuation rose, the instruments it used to raise capital became more valuable to their holders, and accounting rules require that increase to be booked as a non-cash loss. Most of it came in Q2, when the charge reached $59.6 billion, up from $12.8 billion in Q1.
| First half 2026 ($ millions) | Amount |
|---|---|
| Operating loss | (693) |
| Interest income | 1,111 |
| Change in fair value of convertible notes, derivatives and SAFEs | (72,388) |
| Other income (loss), net | (8,757) |
| Provision for income taxes | (21) |
| Net loss | (80,748) |
Source: Daloopa (Anthropic S-1). Other income (loss) includes $8,720 million of non-cash marks on other financial instruments.
These financial-instrument charges are non-cash in the period but remain relevant to financing structure and shareholder dilution. Remeasurement ceases for instruments that convert into equity or are otherwise settled; some notes may remain outstanding after the IPO.
The cash flow statement makes the same point from the other direction. Operating activities generated $3.9 billion of cash in the first half of 2026, compared with a $1.5 billion outflow a year earlier, although it should be noted that there was a $1.2 billion working capital benefit.
| First half 2026 ($ millions) | Amount |
|---|---|
| Net loss | (80,748) |
| Add back: fair-value changes (convertibles and other instruments) | 81,108 |
| Add back: stock-based compensation | 2,185 |
| Add back: depreciation, charitable contributions and other | 216 |
| Cash earnings before working capital | 2,761 |
| Working capital (receivables, payables, deferred revenue and other) | 1,168 |
| Net cash provided by operating activities | 3,929 |
Source: Daloopa (Anthropic S-1 cash flow statement); subtotals calculated.
What we’ll be watching
Breadth of adoption. The share of large customers using both the platform and a first-party application, now 50%, and the continued decline in concentration are important metrics to watch.
Net revenue retention. Net revenue retention was approximately 900% as of September 30, reflecting expansion within the existing qualified customer cohort after contraction and churn. The metric does not separately disclose gross retention, customer churn or renewal rates, and expansion by some customers can offset losses elsewhere.
GAAP operating margin. Q2 was the first quarter of GAAP operating profit, at an 8% margin after stock-based compensation recognized to date. Sustaining that margin as post-IPO RSU expense arrives will be important although investors will also watch adjusted operating margin closely.
The full Anthropic dataset, including quarterly results, KPIs, revenue mix, customer concentration, balance sheet and cash flow, is now available in Daloopa Hub, with every data point hyperlinked to its source in the S-1.
Data sourced from Daloopa. This is research commentary, not investment advice.