
Circle reported second-quarter results on August 5 and, that same morning, put a public mainnet date on Arc. That makes CRCL unusual: the next catalyst is already on the calendar, while the latest financials are still fresh.
To work through it, I ran Daloopa’s model-build skill twice. Daloopa Skills are pre-built, end-to-end workflows that run through the MCP. This skill does three things:
- Queries Daloopa’s financial database
- Pulls Circle’s reported financials
- Writes an Excel model with each data point linked back to its source document
I used it in two passes:
- The first run built the historicals and a forecast driven by six input cells at the top of the sheet.
- The second added Arc to the forecast.
From there, I opened the workbook in Excel, where Daloopa’s Excel Add-In can pull each new quarter directly into the model.
What the financial model covers
Two details matter for anyone who has maintained a model by hand.
- Everything derived stays live: Actuals are values with hyperlinks and everything derived is a live formula, so growth rates, margins and roll-ups recalculate when you touch an input.
- Built-in checks. A checks block ties the balance sheet, the cash flow and every subtotal. Historical columns tie to zero. Forecast columns carry a REVIEW flag because the simplified capex assumption eventually runs fixed assets negative, which is exactly the kind of thing you want flagged rather than buried.
The workbook stays live in Excel
The output is a native .xlsx, so the work does not stop when the skill finishes. I opened the file in Excel and used Daloopa’s Excel Add-In to keep the model connected to the same source-linked data.
Once opened, the add-in sits next to the workbook and supports three main workflows:
- Update pulls the latest data into the model
- Retrofit matches rows in a model you built yourself to Daloopa data, so the add-in can update them too.
- Create Rolled-Up Number keeps subtotals tied to the underlying Daloopa data.
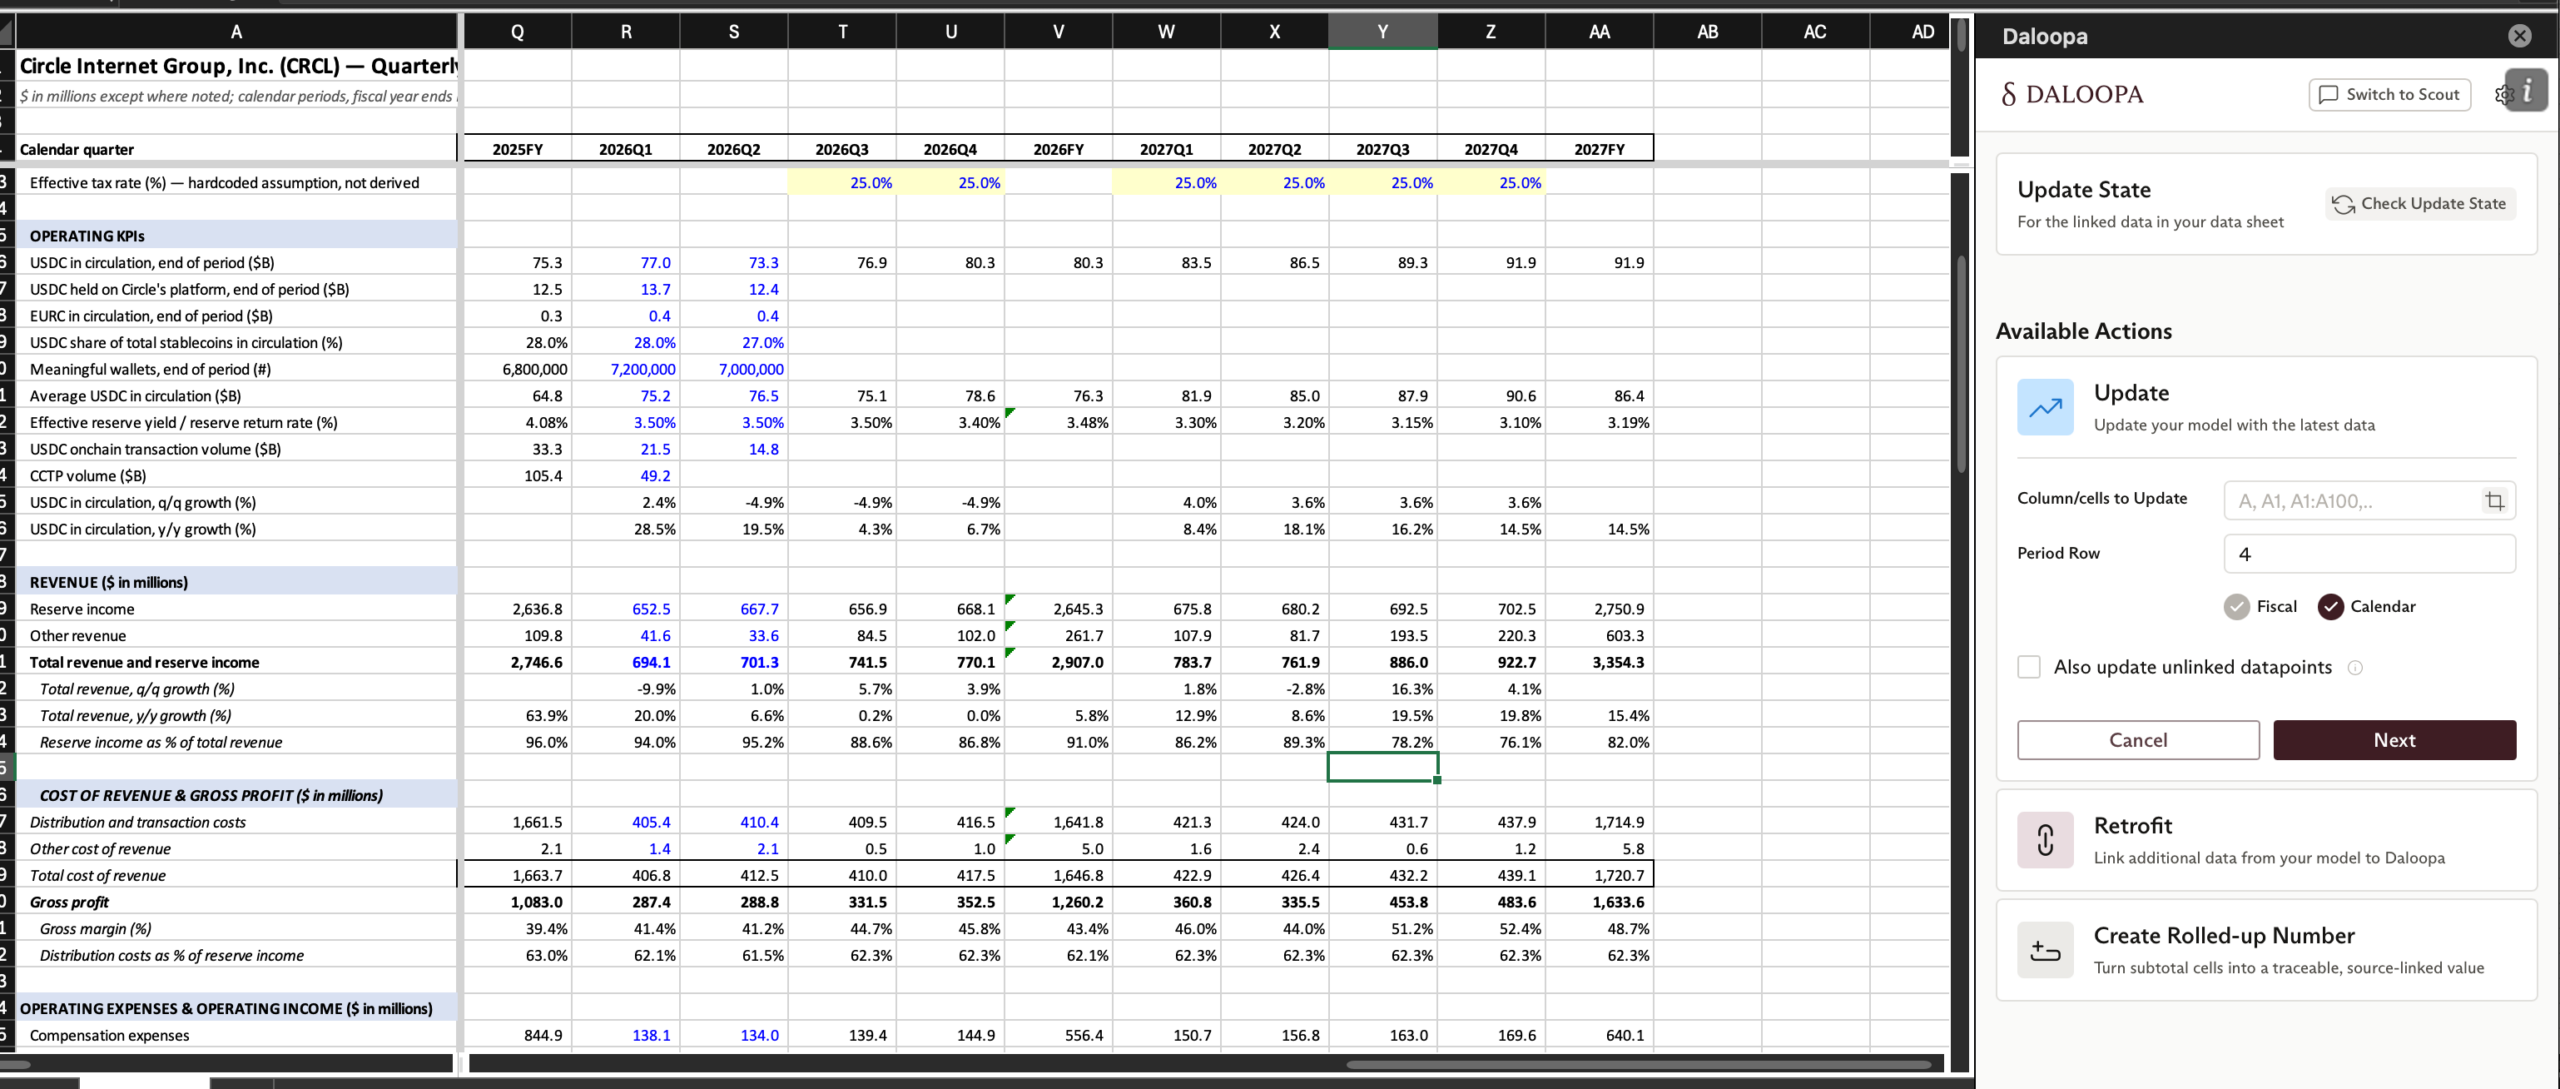
During earnings season, the Update State card shows each quarter’s status and turns to Ready to Update once the print is in. The same status colors highlight the affected cells in your sheet. When Circle reports Q3 in November, the CRCL model above updates the same way: one click, one new column.
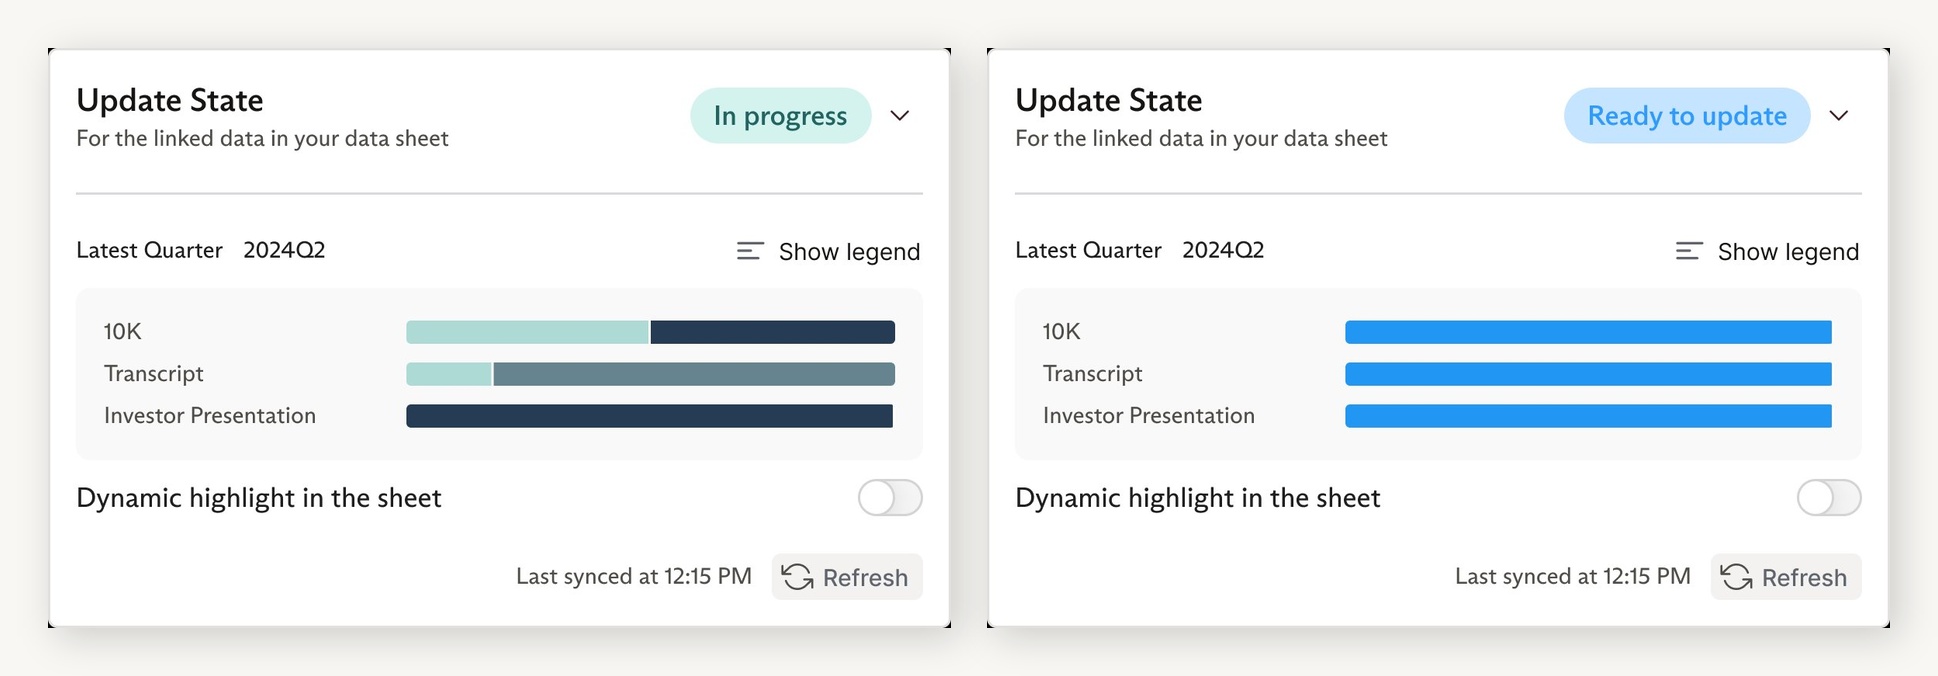
The Update State card during and after data processing for a quarter. Green means ready, blue means already in your sheet.
The structured Q2 data
Here is Q2 2026 straight from the model.
| Metric | Q2 2026 | Q2 2025 | Change |
|---|---|---|---|
| USDC in circulation, end of period | $73.3B | $61.3B | +19.5% |
| Average USDC in circulation | $76.5B | $61.0B | +25.4% |
| Reserve return rate | 3.5% | 4.1% | -60 bps |
| Reserve income | $667.7M | $634.3M | +5.3% |
| Other revenue | $33.6M | $23.8M | +41.1% |
| Total revenue and reserve income | $701.3M | $658.1M | +6.6% |
| Distribution and transaction costs | $410.4M | $406.5M | +1.0% |
| Adjusted EBITDA | $135.8M | $125.8M | +8.0% |
| Net income (loss) | $48.2M | ($482.1M) | +$530M |
| USDC onchain transaction volume | $14.8T | $5.9T | +151% |
Two points stand out:
- First, USDC in circulation ended the quarter at $73.3B, down from $77.0B at the end of Q1. That was the first sequential decline in the model since 2023, even as onchain transaction volume grew 151% year over year. Usage and balances are not moving together.
- Second, average USDC grew 25.4% year over year, but revenue grew only 6.6%. The difference is yield. Circle’s reserve return rate fell from 4.1% to 3.5%, so the business had to run harder just to grow revenue modestly.
What the economics show
Reserve income was $667.7M of the $701.3M total, 95.2% of revenue. Distribution and transaction costs were $410.4M, which means 61.5 cents of every reserve dollar goes out the door to Coinbase and other distribution partners before Circle touches it.
Today, Circle is a rate-sensitive, USDC-driven business with expensive distribution. Diversifying that revenue base is the open question, and Arc is the company’s answer to it.
Adding Arc
Arc is Circle’s Layer 1 blockchain. Public mainnet is scheduled for September 16, 2026. The network uses USDC as its native gas token and is designed for EVM compatibility, sub-second finality, and institutional use cases.
The validator list is relevant because it shows the types of institutions Circle is targeting with Arc. Circle announced BlackRock, DTCC, Galaxy, Global Payments, ICE, Mastercard, MoneyGram, SBI Group, Standard Chartered, Sumitomo Corporation, and Visa as part of the founding validator cohort. BlackRock is expected to deploy BUIDL on Arc, and Circle is working with DTCC to tokenize DTC-custodied assets beginning in the second half of 2027. Circle’s May whitepaper set ARC token supply at 10 billion, with 60% allocated to ecosystem development, 25% to Circle, and 15% to long-term reserves.
I ran Daloopa’s model-build skill a second time to add Arc to the forecast. In the model, Arc first affects one line: other revenue.
Management raised 2026 other revenue guidance to $310M to $330M on the Q2 call, driven by Arc token presales. The CFO also attributed part of the Q2 sequential decline in other revenue to Circle deliberately prioritizing Arc over other blockchain partnerships. That puts the near-term revenue contribution and the related tradeoff in the same line item.
This is where the driver-based model is useful. The default other revenue driver uses trailing four-quarter growth, decaying 10% per quarter. That produces $261.7M of 2026 other revenue, below management’s updated guide.
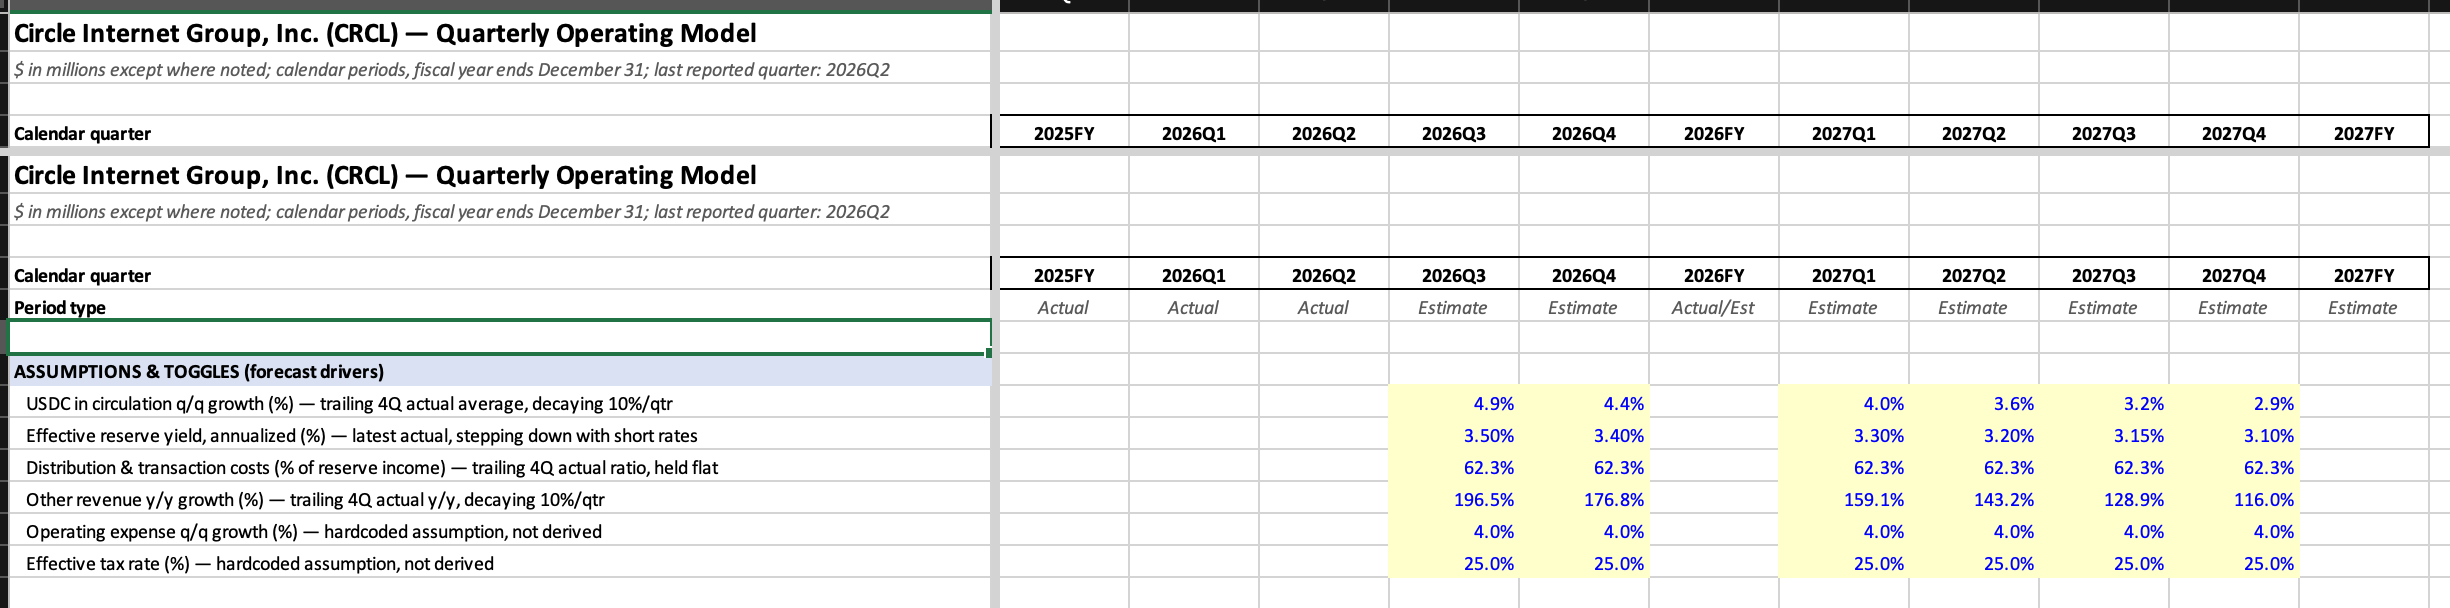
The difference between the mechanical forecast and the $310M to $330M guide is the Arc-related assumption the model needs to handle. It sits in one editable assumption cell. Move the driver toward guidance and 2026 revenue rises from $2,907M to roughly $2,960M. Leave it unchanged and the model treats more of the token presale revenue as non-recurring.
Either way, the model makes the assumption explicit.
The key Arc drivers
The other revenue growth row is the direct Arc assumption. In the default case, it starts at 196.5% trailing growth in 2026Q3 and decays to 116.0% by 2027Q4. Changing any quarter adjusts only that quarter’s Arc-related contribution.
The USDC circulation growth row is the indirect assumption. Because Arc uses USDC as its native gas token, changes in Arc activity could eventually show up in circulation as well as other revenue.
The reserve yield row captures the macro assumption. If rates move faster or slower than the model’s 3.5% to 3.1% glide path, that input changes the reserve income forecast.
Change any of those inputs and the income statement, balance sheet, EPS bridge, and checks all update together. There is no separate scenario module to configure. The scenario is just the cells.
What the forecast says
These are model outputs on default drivers, all computed from the linked actuals above:1
| Model output (est.) | 2026Q3E | 2026Q4E | 2026FY | 2027FY |
|---|---|---|---|---|
| USDC in circulation, end ($B) | $76.9 | $80.3 | $80.3 | $91.9 |
| Reserve income ($M) | $656.9 | $668.1 | $2,645 | $2,751 |
| Other revenue ($M) | $84.5 | $102.0 | $261.7 | $603.3 |
| Total revenue ($M) | $741.5 | $770.1 | $2,907 | $3,354 |
| Gross margin | 44.7% | 45.8% | 43.4% | 48.7% |
| Operating income ($M) | $66.1 | $76.5 | $222.0 | $414.6 |
| Diluted EPS | $0.23 | $0.26 | $0.89 | $1.36 |
| Reserve income % of revenue | 88.6% | 86.8% | 91.0% | 82.0% |
The drivers behind these outputs are visible at the top of the sheet: USDC circulation growing 4.9% quarter over quarter and decaying 10% per quarter, the reserve yield stepping from 3.5% to 3.1% with expected rate cuts, distribution costs held at 62.3% of reserve income, operating expenses growing 4% per quarter and a 25% tax rate.
On those settings reserve income falls from 95.2% of revenue in Q2 2026 to 82.0% for 2027. The model therefore shifts more revenue mix toward other revenue, largely from Arc-adjacent assumptions compounding off a small base.
Bear flags, bull variables
The bear case is in the actuals. USDC circulation just declined sequentially for the first time in over two years. The reserve yield has compressed 60 basis points in four quarters and future rate cuts would add more pressure. Distribution partners still capture more than 60% of reserve income. The raised other revenue guide depends partly on token presales, which may not behave like recurring revenue. And at roughly $61 per share going into the print, the stock traded near 45x the model’s 2027 EPS.2
The bull case starts with the same data. USDC circulation still grew 19.5% year over year, and onchain transaction volume grew 151%. That means the network saw more activity even though balances were weaker sequentially. Circle also had $1.73B of corporate cash, which gives it funding capacity for the Arc buildout without adding leverage.
The validator cohort is the main Arc variable to watch. If Arc turns some of those institutional relationships into fee-generating activity, the effect should appear in other revenue and potentially in USDC circulation. The reason it matters in the model is mix: reserve income falls from 95.2% of revenue in Q2 2026 to 82.0% in 2027 under the default assumptions.
September 16 is the next date when the Arc assumptions can begin to be tested against actual activity. My tracking metric is other revenue versus the $310M to $330M guide, updated when Q3 numbers hit Daloopa.
A note on the data
Everything above came from two runs of the same model-build skill.
The first run built the historical model, pulled fifteen quarters of fundamentals, and produced a workbook where reported numbers link back to source documents and derived numbers are formulas. The second run added Arc to the forecast and preserved the pre-Arc version in the same file.
When Circle reports Q3 in November, Daloopa’s Excel Add-In can update the model in place. The alternative is manual quarterly data entry: slower, easier to break, and harder to audit.