
On July 2, 2026, Jersey Mike’s Subs (JMKE) filed its S-1 to list on the NYSE. There is no price range yet, no share count, and no trading history. Blackstone bought its majority stake in late 2024 at a reported $8 billion valuation, and press reports put the IPO ask at $12 billion. The filing is 300-plus pages. The financials span a predecessor and successor period. None of the banks have initiated coverage. However, Daloopa structured the full S-1 data, allowing us to run two Skills via their MCP: initiate coverage and build a model in minutes. Daloopa Skills are specialized instructions built into the MCP that automatically guide your LLM through an end-to-end financial workflow.
The P&L under Blackstone
If I described an asset-light company with EBITDA margins (albeit adjusted for the debt load) in the 40% range, backed by a massive backlog providing visibility for years, you would probably guess it was an AI stalwart. Instead, it’s the highest-rated fast-food chain, recently overtaking Chick-fil-A, Jersey Mike’s.
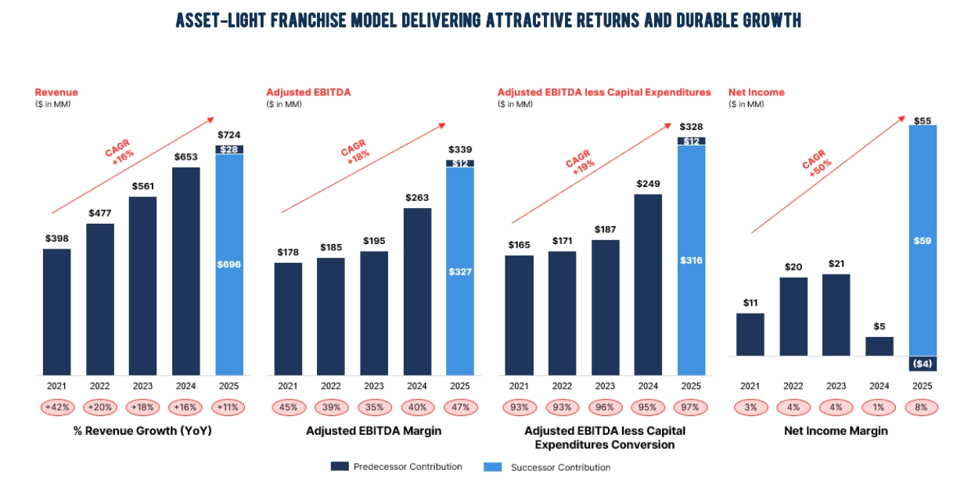
Franchise royalties (including related advertising fees from franchises) make up roughly 95% of total revenue, with a small company-owned store base on top. Revenue grew from $561mm in fiscal 2023 to $653mm in 2024 and $724mm in 2025, a +11% increase in 2025 on top of +16.4% in 2024 (growth computed from the linked figures).
| $mm | FY2023 | FY2024 | FY2025 | Q1 2025 | Q1 2026 |
|---|---|---|---|---|---|
| Royalties and other revenues | 371 | 434 | 483 | 111 | 122 |
| Advertising fees | 160 | 183 | 203 | 47 | 51 |
| Company-owned stores sales | 30 | 36 | 38 | 9 | 12 |
| Total revenue | 561 | 653 | 724 | 167 | 185 |
| YoY growth | +16.4% | +10.9% | +10.8% | ||
| SG&A | 262 | 349 | 233 | 58 | 78 |
| Advertising expenses | 208 | 220 | 215 | 52 | 61 |
| Depreciation and amortization | 10 | 10 | 96 | 21 | 26 |
| Operating income | 57 | 44 | 151 | 29 | 12 |
| Interest expense | 41 | 43 | 104 | 23 | 30 |
| Net income (loss) | 21 | 5 | 55 | 10 | (24) |
| Adjusted EBITDA | 195 | 263 | 339 | 68 | 84 |
| Adjusted EBITDA margin | 35% | 40% | 47% | 40% | 45% |
Source: Daloopa (JMKE S-1)
Three things jump off this table. Operating income more than tripled in 2025 because founder-related discretionary costs were removed from SG&A, not because unit economics changed. D&A stepped from $10mm to $96mm because purchase accounting created amortizable intangibles. And the company printed a $24mm net loss in its most recent quarter, the one right before the roadshow.
The franchise machine
The system itself is healthy. Systemwide sales reached $4,217mm in 2025, up +12.9%), on 3,256 stores. Only 26 of those were company-owned at year-end. This is a 99% franchised royalty stream.
| KPI | FY2023 | FY2024 | FY2025 | Q1 2025 | Q1 2026 |
|---|---|---|---|---|---|
| Systemwide sales ($mm) | 3,342 | 3,735 | 4,217 | 1,010 | 1,097 |
| Same-store sales growth | +8.4% | +2.0% | +3.2% | +4.9% | +1.7% |
| Total system store count | 2,686 | 3,002 | 3,256 | 3,300 | |
| Gross openings | 298 | 323 | 267 | 47 | |
| Average unit volume ($K) | 1,307 | 1,328 | 1,364 | 1,341 | 1,368 |
| Digital sales mix | 38% | 40% | 42% | 42% | 44% |
Source: Daloopa (JMKE S-1)
The comp trajectory is the number to watch. Comps ran +8.4% in 2023, fell to +2.0% in 2024, recovered to +3.2% in 2025, then exited the year at +0.5% in Q4 and +1.7% in Q1 2026. Unit growth is doing nearly all the systemwide work now. Management’s own internal plan, disclosed as guidance in the S-1, penciled next year quarterly comps at +2.3%. These assumptions underpin the valuation implied by a premium multiple.
What the initiate skill flags
The initiate skill is built to identify both opportunities and potential risks. Four things came out of the pass that would headline the bear column of the note.
The adjusted EBITDA bridge does heavy lifting. The reconciliation adds back $112mm of founder-related discretionary expenses in 2023 and $192mm in 2024. The 2024 add-back alone equals 29% of that year’s total revenue (computed from the linked figures). Those costs are gone under Blackstone, which is real, but the 35% to 47% margin walk is partly definitional. Meanwhile, a new add-back has taken its place: area director buyouts ran $52mm in 2025 and another $32mm in Q1 2026 alone. Buying out the legacy field structure is a cash cost that has recurred every period so far, whatever the reconciliation calls it.
Leverage is a significant factor in reported earnings. Total debt sits at $2,122mm after a new securitization series in early 2026, against $232mm of cash. In Q1 2026, operating income of $12mm was swamped by $30mm of interest expense and a $7mm loss on debt extinguishment, producing the $24mm net loss. Cash paid for interest more than doubled to $82mm in 2025 from $37mm in 2024.
How the cash moved pre-IPO. Member distributions totaled $468mm in 2025 while operating cash flow was negative $210mm, driven by transaction-related payments in the acquisition year. Cash fell from $811mm at the end of 2024 to $215mm at the end of 2025. Q1 2026 operating cash flow of $86mm shows the underlying engine works.
The balance sheet reflects purchase accounting. Total assets increased from $1,044mm to $8,181mm in one year, of which $5,710mm is a trade name intangible and $395mm is goodwill. Members’ equity swung from negative $866mm to positive $5,903mm. Book value tells you what Blackstone paid, not what the business earns. Valuation work should run off cash flow rather than book value.
The bull case I would underwrite
None of that means the asset is bad. It means the asset is priced for the bull case, so state it precisely. Jersey Mike’s is a nearly 100% franchised royalty stream with almost no capital intensity: capital expenditures were $11mm in 2025 against $339mm of adjusted EBITDA, and adjusted EBITDA less capex was $328mm, a 97% conversion rate. The system added roughly 250 to 320 gross units a year for three straight years; AUVs keep grinding higher, and digital mix hit 44% in Q1 2026. Blackstone installed Charlie Morrison, who built Wingstop’s franchise flywheel, as CEO. If comps reaccelerate toward 3% and unit growth holds, the royalty stream compounds in double digits with almost no incremental capital. The Q4 and Q1 comps are evidence against it, and they are the first thing to monitor once the company starts reporting.
From the same pass, the model
Everything above came out of the initiate skill. The build model skill takes the identical data pull and assembles a nine-tab workbook: Dashboard, Income Statement, Balance Sheet, Cash Flow, Segments, KPIs, Projections with yellow editable assumption cells, DCF, and Comps.
Trailing twelve-month adjusted EBITDA works out to roughly $355mm, computed as fiscal 2025 adjusted EBITDA less the Q1 2025 quarter plus the Q1 2026 quarter. At the reported $12 billion equity ask, plus $2,122mm of debt and net of $232mm of cash, enterprise value lands near $13.9 billion, roughly 39x trailing adjusted EBITDA (computed from the linked figures). A valuation comparable to leading franchised restaurant peers despite recent same-store sales growth below 2%. The Projections tab lets you flex the two assumptions that matter, comp recovery and unit growth, and watch what multiple the DCF can support. The gap between those two numbers is the entire IPO debate.