
Large language models (LLMs) now let you pull structured line items, harmonize multi-year figures, and inject model-ready data into Excel faster than manual spreading—streamlining the plumbing that used to eat analyst time and making it possible to move from data collection to insight in hours rather than days. This evolution marks a new chapter in financial statement analysis with large language models, giving analysts powerful tools to cut through complexity.
Key Takeaways
- Large language models can now automate tasks like ratio analysis, earnings breakdowns, and trend detection that once demanded manual data preparation.
- They can process extensive volumes of financial documents with high speed, though their accuracy dips when confronted with very specialized accounting or non-standard reporting.
- Integrating LLM-powered tools into analyst workflows can speed up research and improve coverage, provided human oversight is applied at the critical decision stages.
Using LLMs to Analyze Complex Financial Documents
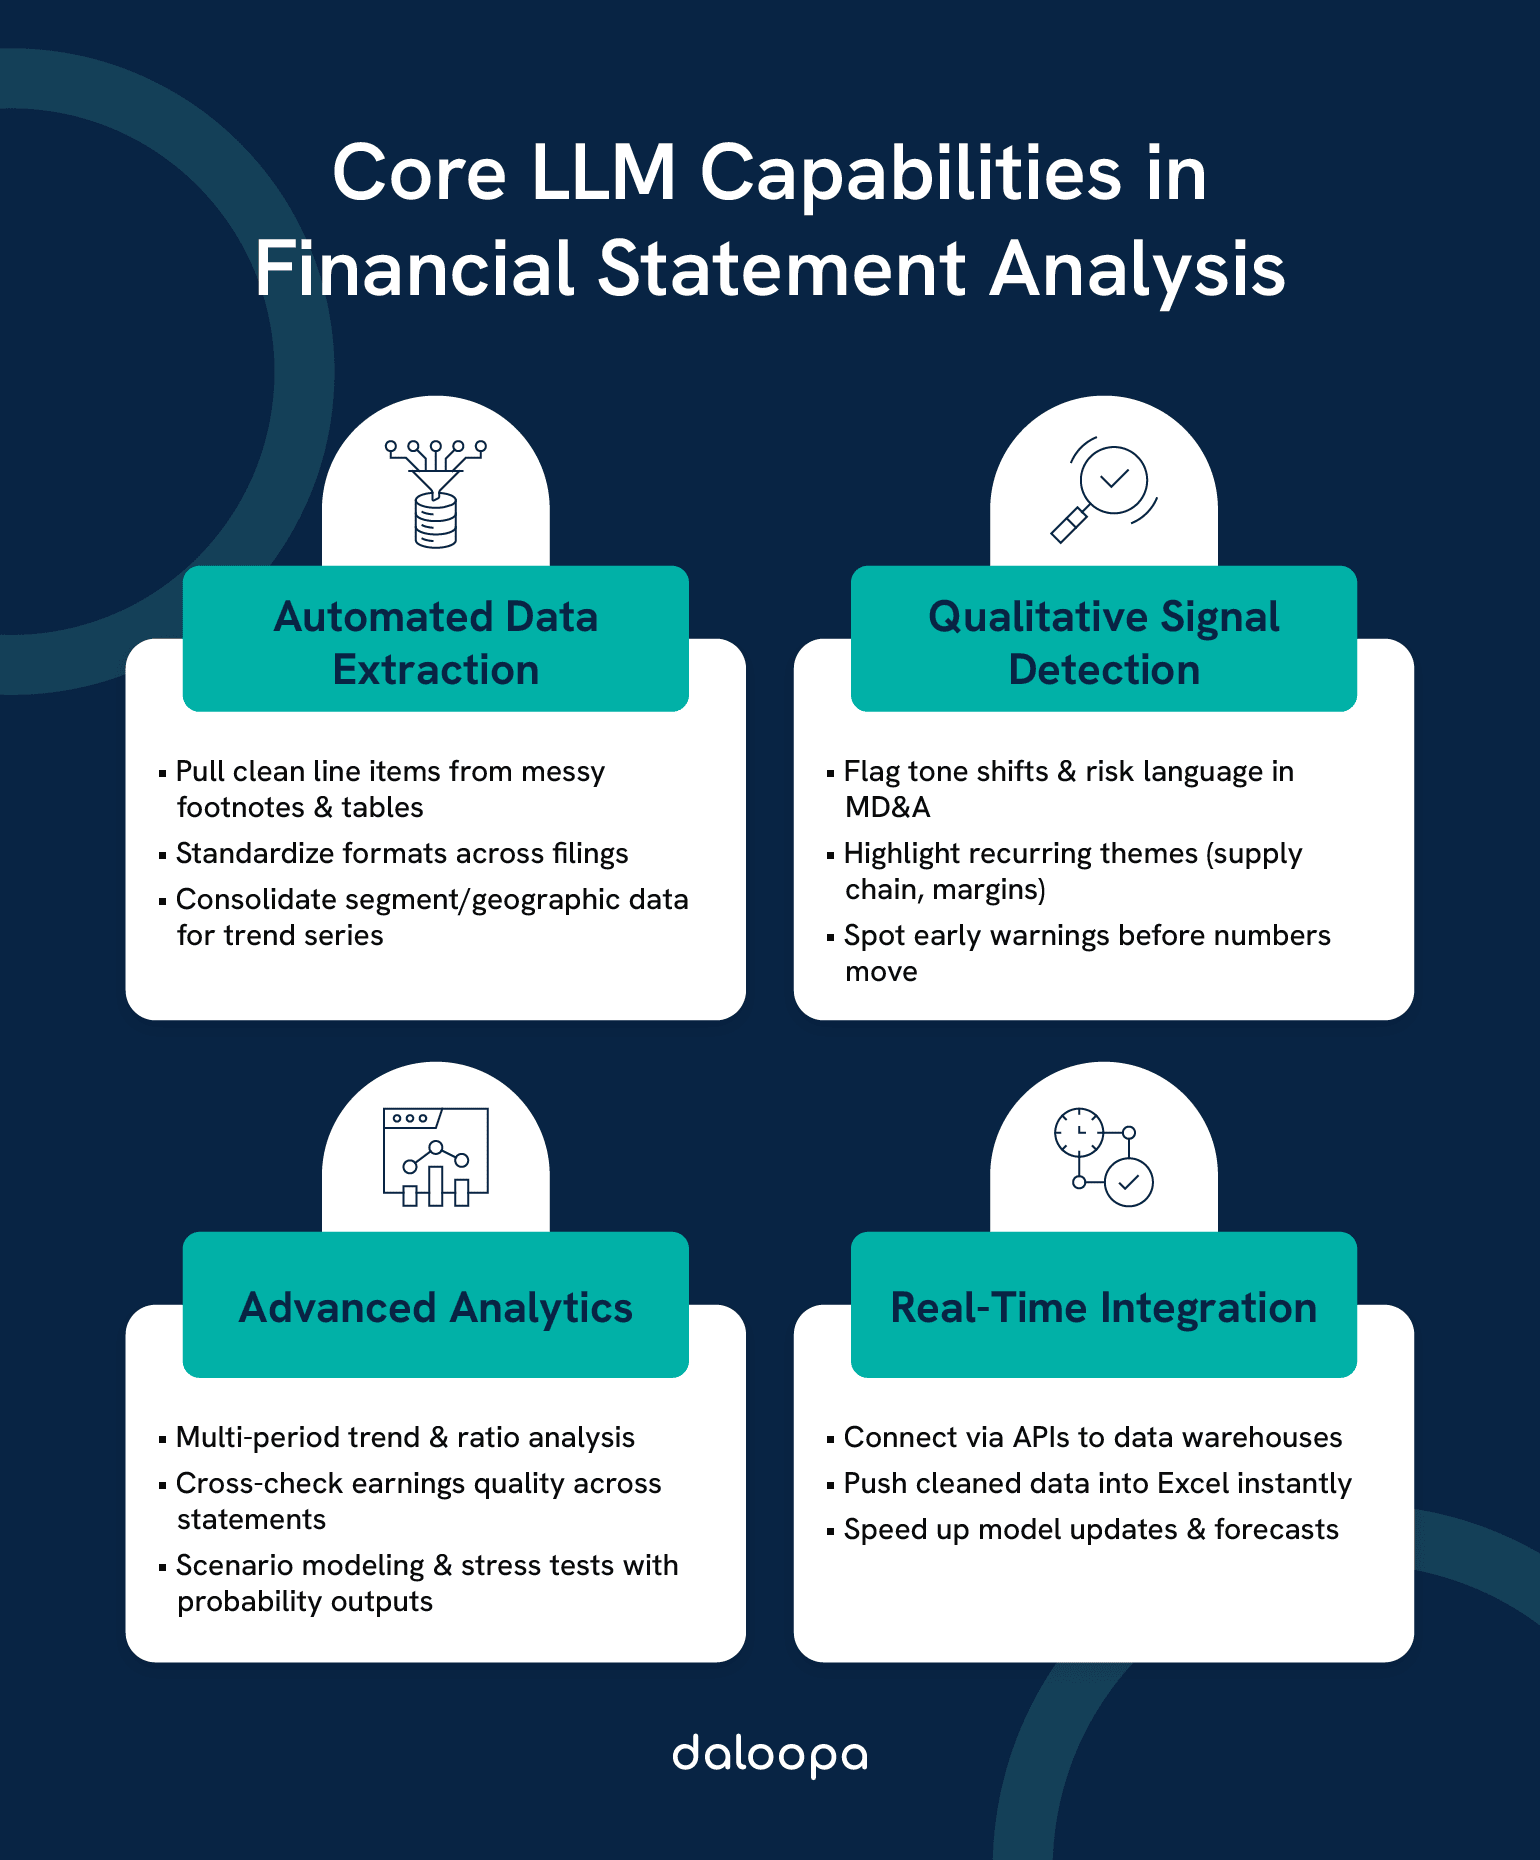
You should think of LLMs as multipurpose research assistants: they extract, standardize, summarize, and run quantitative routines across years of filings. They handle both the free-text discussion around results (MD&A, risk factors) and the numeric tables that underpin your models. This ability makes financial statement analysis with large language models a force multiplier for analysts managing high volumes of reporting.
Information Extraction From Unstructured Financial Statements
You encounter messy footnotes, nested tables, and inconsistent line labeling every reporting season. These complexities make traditional analysis slow and error-prone. LLMs read these documents at scale and can extract line items into standardized schemas so you don’t lose time reconciling different table formats. When you feed many filings into a single pipeline, the model can consolidate geographic or product-line disclosures that were spread across several pages into one usable series for trend analysis. This improves automated financial analysis efficiency while reducing manual copy-paste risk.
You can also use LLMs to surface qualitative signals inside Management’s Discussion & Analysis—tone shifts, repeated emphasis on supply-chain or margin pressures, or management’s forward-looking caveats—that often precede measurable financial changes. Pairing those narrative flags with numeric extractions helps you prioritize which companies need deeper human review.
Practical Applications And Implementation
LLMs fit into several practical workflows you already run: model updates, screening, audit prep, and scenario testing. You can embed them via APIs into data warehouses or use them through Excel plug-ins that inject cleaned line items directly into your forecasts. That flexibility lets you choose where automation provides the biggest ROI—often the heavy-lift, repetitive stages of data collection and reconciliation.
In practice, financial statement analysis with large language models empowers hybrid workflows: automated summaries for triage paired with expert review for interpretive insights. You’ll want to map which parts of your workflow gain the most from automation and which still demand analyst judgment. This balance keeps AI in financial analysis and reporting both efficient and reliable.
Financial Statement Component Analysis
LLMs accelerate the core calculations you rely on every day:
- Liquidity ratios: current ratio, quick ratio, cash ratio.
- Profitability metrics: gross margin, operating margin, ROE, ROA, and full DuPont decompositions.
- Leverage indicators: debt-to-equity, interest coverage, and debt service coverage.
Whether the numbers come from XBRL, PDF tables, or spreadsheet exports, the model can align fields across periods and produce consistent series for your time-series analysis. When anomalies occur—like a sudden surge in prepaid expenses—the system can emit a narrative flag explaining plausible reasons (supplier prepayments, upfront contract payments, or an accounting policy change) so you can decide whether to adjust your working model. This is the foundation of automated financial analysis in modern workflows.
Advanced Analytical Techniques
Move beyond single-period ratios. Financial statement analysis with large language models enables:
- Running multi-period trend analysis (3–5 years or more) to separate seasonality from structural change.
- Applying cross-statement validation to test earnings quality (e.g., rising net income vs. falling operating cash flow).
- Generating scenario models that simulate commodity price swings, FX moves, or interest rate changes and output probability-weighted earnings distributions.
You can ask the model to stress-test a margin line or to show how a 5% increase in raw material costs would cascade through gross margin, operating income, and cash balances. These capabilities showcase the strength of AI in financial analysis and reporting, where scale meets predictive insight.
Implementation Strategies And Challenges
You’ll find the best outcomes when you treat LLMs as one component in a robust pipeline—data ingestion, normalization, model prompting, validation, and human review. Common implementation patterns:
- Preprocessing & normalization: Convert dates, harmonize segment labels, and unify currency reporting before feeding data to the model. Good preprocessing reduces model confusion and improves repeatability.
- Hybrid workflows: Let the AI do initial screening (spread filings, calculate ratios, summarize MD&A) and have analysts perform final adjustments and judgement calls.
- Backtesting & validation: Regularly compare AI outputs to historical realized earnings and human forecasts; tune prompts and pipelines based on out-of-sample performance.
- Governance: Create protocols for model updates, change logs, and an approval process for production changes—especially when outputs feed investment or regulatory decisions.
Technical challenges remain. Inconsistent reporting labels, embedded tables in PDFs, and odd XBRL implementations still trip up automated extraction. That’s why you should build normalization steps that detect and correct unusual formats before calculating ratios; the SEC and taxonomy providers publish guides that describe the landscape any automated system must respect.
With proper preprocessing, automated financial analysis delivers cleaner, faster, and more reliable results than traditional manual workflows. At the same time, firms that adopt AI in financial analysis and reporting early gain a competitive advantage, both in operational efficiency and in reducing analyst workload.
Case Studies And Benchmarking
Controlled studies and independent research illustrate where LLMs add measurable value—and where you should be cautious. Academic and industry studies show LLMs can match or even beat analyst baselines on tasks like predicting earnings direction when given structured financials and when the evaluation isolates numeric reasoning from qualitative corporate knowledge. Those gains are especially visible in industries with complex working capital dynamics or non-cash charges (e.g., energy, telecom). This is where financial statement analysis with large language models proves transformative, particularly in industries with complex working capital dynamics.
Benchmarks also show the importance of input quality. When datasets are normalized and each figure links back to its source, researchers observe lower hallucination rates and improved model stability. In practice, teams who run side-by-side comparisons—AI outputs versus human-blended workflows—see the clearest picture of where to trust automation and where to apply stricter review. For many firms, this shift marks the turning point from experimental pilots to full-scale adoption of automated financial analysis as a core capability.
During market turbulence, automated, data-driven calls often stay more consistent than sentiment-driven human reactions. That consistency can be an asset for screening and risk monitoring, but you must still layer human judgment on top for event-driven narrative changes or novel accounting treatments.
Try Daloopa For LLM-Powered Financial Statement Analysis
If you want LLM outputs you can rely on, the missing ingredient is often the data layer. Clean, normalized, and auditable inputs allow financial statement analysis with large language models to focus on analysis rather than on reconciling inconsistent filings.
Daloopa converts unstructured filings (10-K/10-Q/8-K) into normalized datasets where every line item traces back to the original source, provides Excel integrations and APIs, and empowers AI in financial analysis and reporting to perform at its best, so you can drop model-ready inputs into your workflow. Reported pilot results show meaningful improvements in model accuracy and 0% hallucinations when teams replace ad hoc data plumbing with standardized datasets and validation checks.
Demo Daloopa for LLMs live and see how your models change when the input noise disappears—compare your current outputs side-by-side with normalized, auditable data and measure reductions in error rates, faster inference, and cleaner multi-period trend analysis.


