
Picture this: It’s 9 PM, and you’re still manually copying financial data from PDF filings into Excel while your manager expects a preliminary M&A analysis by morning. Every analyst has been there—the frustration of juggling scattered spreadsheets, incomplete disclosures, and the nagging fear that you’ve missed a critical data point that could undermine your credibility. The pressure to deliver fast, accurate insights isn’t just about meeting deadlines; it’s about proving you can be trusted with bigger deals. The good news? You can shave hours off research time by using reproducible Excel workflows and trusted data sources that feed directly into your models. You can streamline M&A research by knowing the right sources and Excel workflows to pull enterprise values, deal terms, and key metrics with confidence.
Key Takeaways
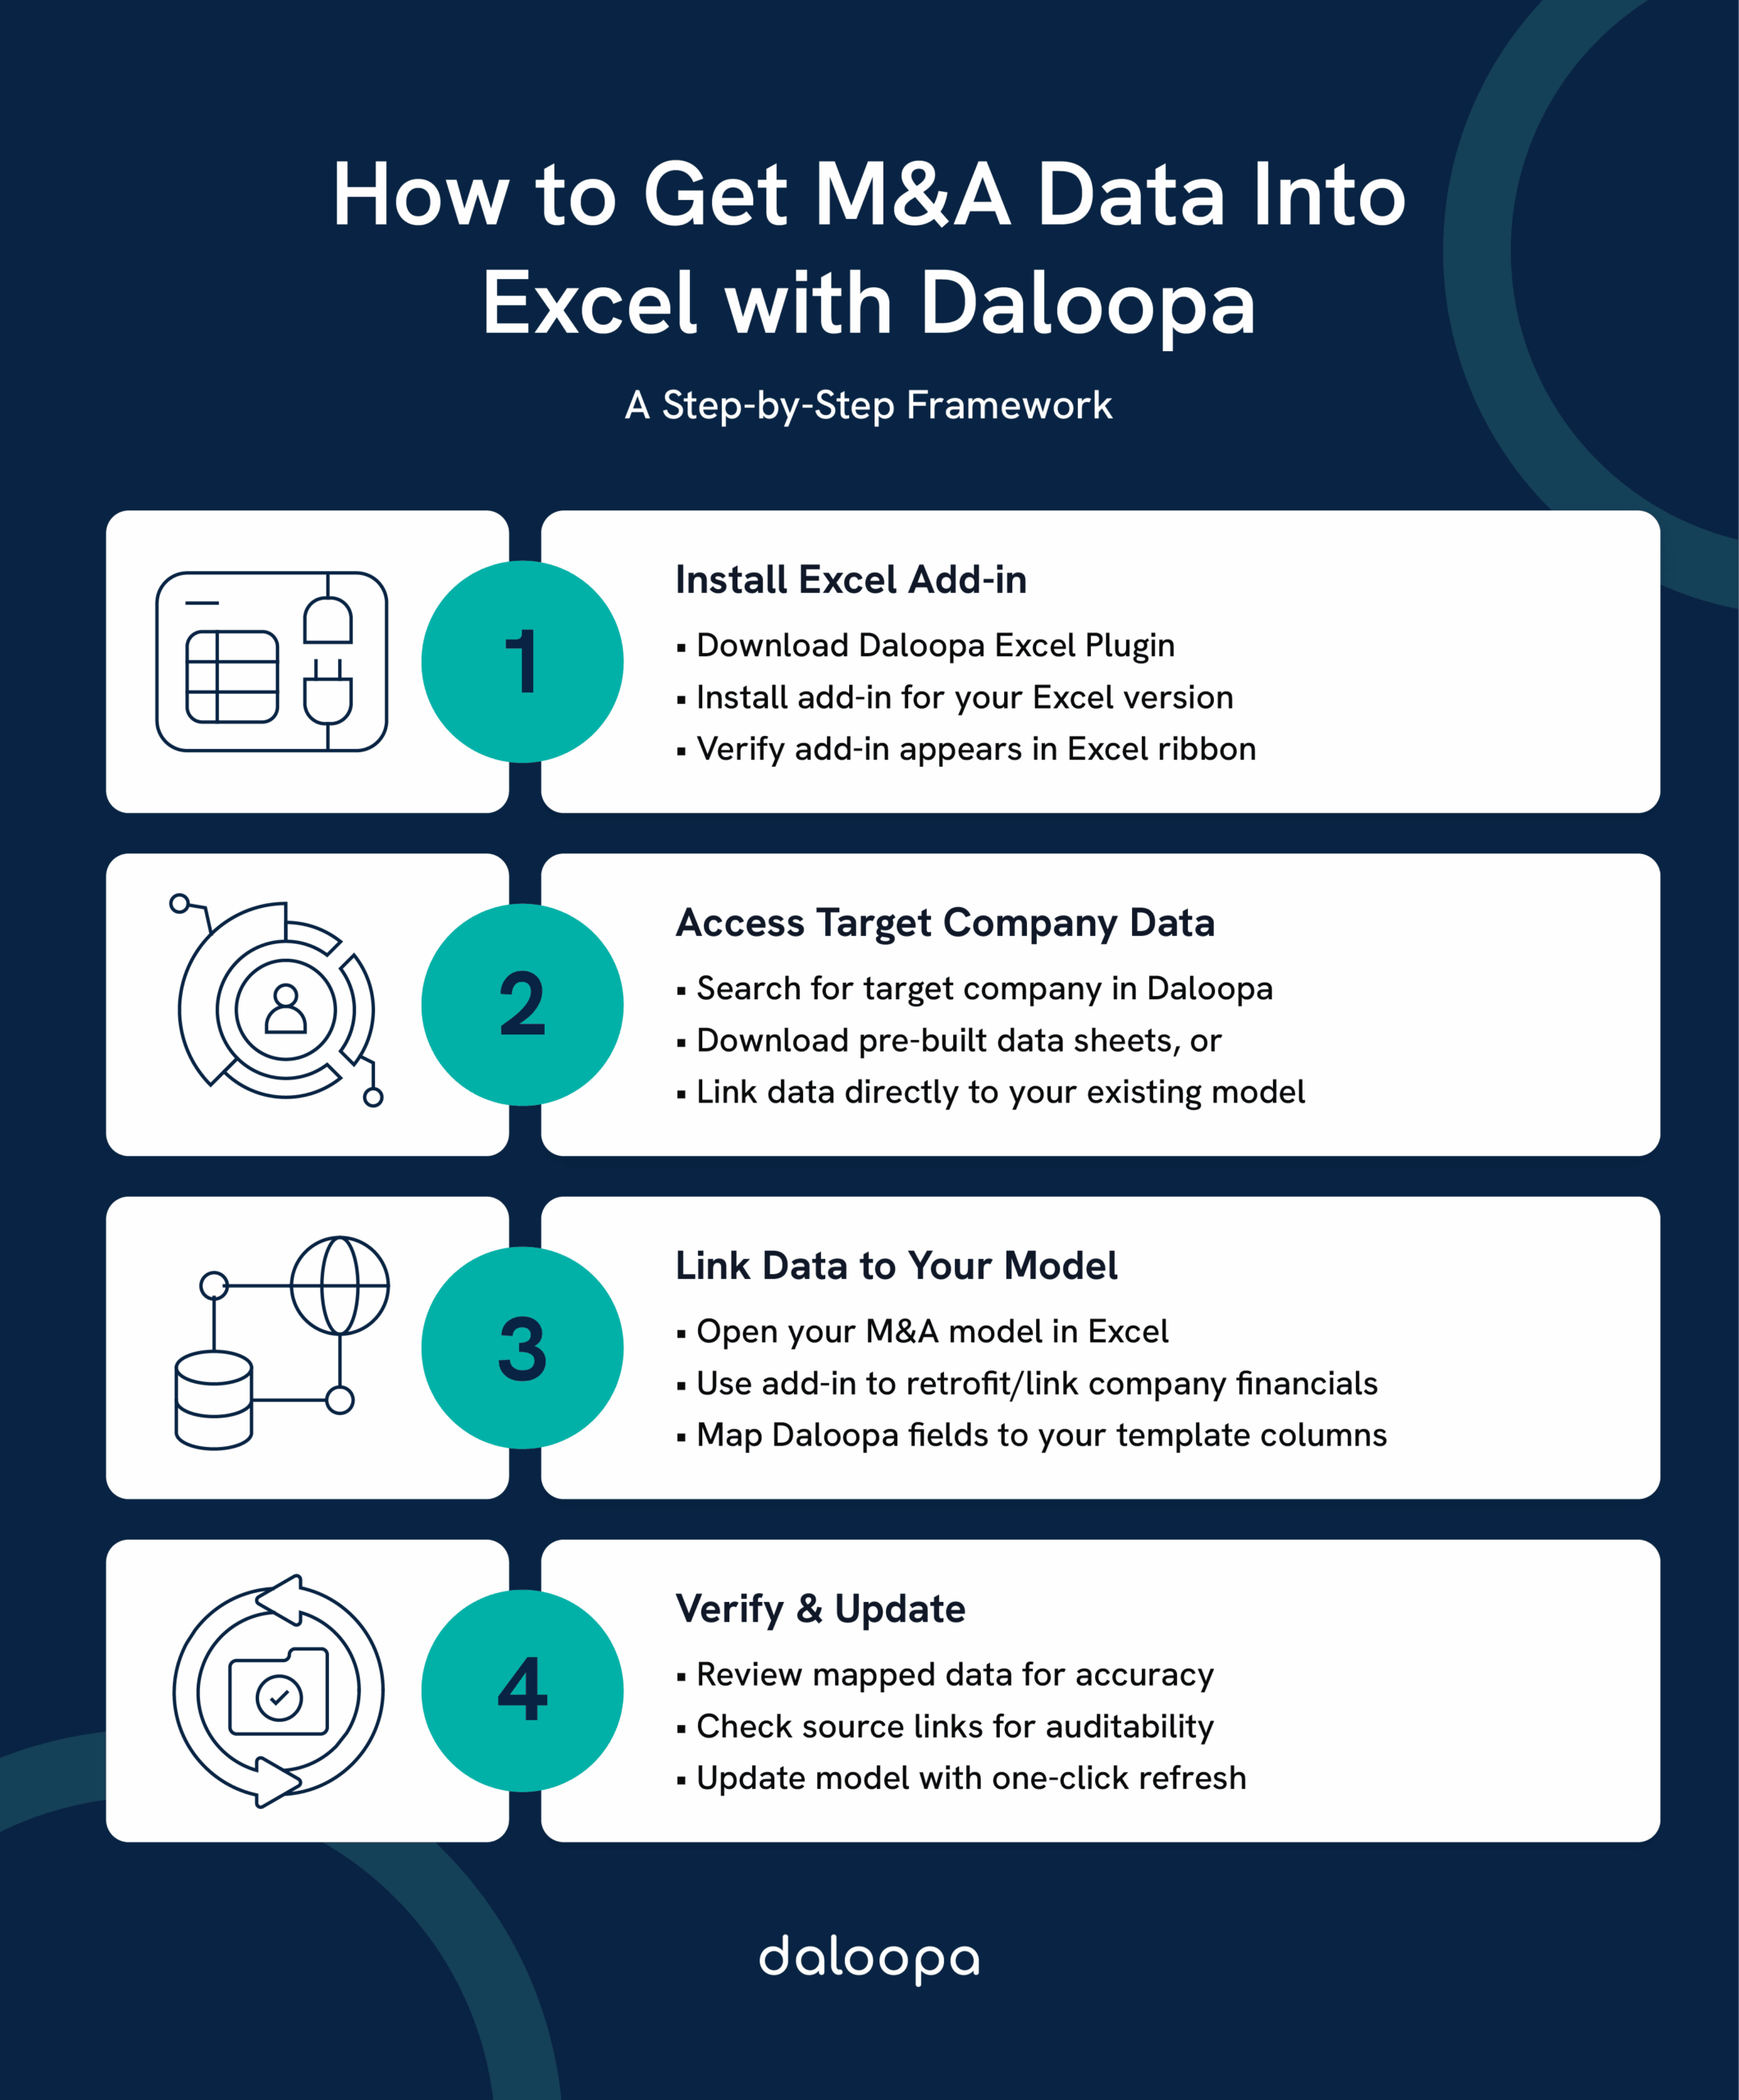
- Modern analyst tools like Daloopa provide direct Excel export functions for clean M&A financial data.
- Excel add-in functions automate data extraction from SEC filings, letting analysts retrofit live financial data into existing models without manual copy-paste.
- Structured Excel templates and data organization methods enable faster analysis of enterprise values and transaction multiples.
Understanding M&A Data Sources And Requirements
Successful M&A analysis depends on mixing sources: commercial databases for breadth, public filings for audited detail, and targeted industry research for realistic assumptions. Your collection plan should map to the model’s purpose (deal screening vs. transaction diligence) and to the decisions your audience must make—what tradeoffs are material, what sensitivities change the recommendation, and where you must show source-level traceability.
Essential M&A Data Points For Financial Modeling
You’ll want to capture three buckets of data cleanly in Excel:
Target fundamentals (historical & pro forma)
- 3 years (minimum) of Income Statement, Balance Sheet, Cash Flow; common-size rows help quick normalization. Platforms like Daloopa automate this collection by pulling standardized financial statements directly from SEC filings, saving hours of manual extraction and reducing transcription errors.
Deal mechanics
- Enterprise value / total consideration, breakdown of cash vs. stock vs. contingent consideration, assumed debt, transaction fees, and any escrows or holdbacks. Pull these line items from merger agreements or 8-K exhibits.
Strategic & synergy assumptions
- Revenue synergies, cost synergies, integration timelines, expected capex / working capital impacts, and sensitivity around realization rates. Use consulting benchmarks as sanity checks (cost synergies frequently realize earlier than revenue synergies).
Professional Financial Databases
Premium platforms speed work and reduce transcription risk because they let you export structured datasets directly into Excel. Typical workflows are: Query → select fields (EV, deal date, buyer, seller, consideration components, multiples) → export to CSV/Excel → map to your template.
Built specifically for analysts who need audited, source-linked data in Excel without manual entry, Daloopa’s Excel add-in retrofits company financials directly into your existing models with one-click updates, making it particularly powerful for teams that run recurring M&A screens or need to refresh models as new filings drop. Unlike traditional databases that export static CSVs, Daloopa maintains live links to SEC filings, so you can trace every number back to its source page—a lifesaver during diligence when auditors question your data provenance.
Free And Low-Cost Data Alternatives
When budgets constrain you or you’re running a quick market scan before committing to deeper analysis, public sources will get you surprisingly far. Use these for initial screens and early-stage target identification, but recognize the tradeoff: you’ll spend more time on manual extraction and verification. For final client deliverables or investment committee presentations, the risk of data gaps usually justifies moving to professional sources.
- SEC EDGAR (proxy statements DEF 14A, 8-K, 10-K, exhibits) — authoritative source for audited statements and deal exhibits (merger agreements frequently include schedules that show consideration and assumptions).
- Company filings & investor presentations — useful for management guidance, pro forma tables, and disclosed synergy targets.
- Academic & government datasets — university research from institutions like Wharton Research Data Services and government reports can provide historical M&A stats or sector-specific benchmarks.
- Free screens (Google Finance / Yahoo Finance) — quick financial snapshots and time series for implied-premium calculations in early work. Use them only for initial screens.
These sources ground your model in audited numbers but require more manual extraction and verification—plan extra time and build traceability tabs that record source URLs and exact file names. When building models for client presentations or board meetings, professional databases or purpose-built tools like Daloopa cut the risk of missing details that could undermine your credibility under questioning.
Extracting And Organizing M&A Data In Excel
Getting good output depends on how you structure intake. If your folders and tabs are inconsistent you’ll spend more time fixing than modeling. This setup work feels tedious when you’re under deadline pressure, but it’s the difference between models that break when you refresh data and models that let you answer follow-up questions in real time during senior review meetings.
Setting Up Your Excel Framework
Create a single master workbook per deal or per sector play with clearly labeled tabs: 02_Assumptions, 03_Historical, 04_ProForma, 05_Valuation, 06_Sensitivity, 99_Sources. Keep formulas modular: drivers on assumptions, calculations on dedicated schedules, and outputs on a presentation-ready dashboard. Use these practical tricks: color-code inputs (blue), links/constants (black), and checks (red); add a DataTrace table that records the exact SEC exhibit, page, and line where each major input came from.
Template checklist (quick)
- Master assumptions with named ranges.
- Historical rollback mapping (mapping raw line names to your standardized headers).
- A Normalization section to align fiscal year-ends and currency.
- A reconciled Deal Mechanics table that decomposes consideration.
Data Extraction Techniques From Professional Databases
When you have database access, follow efficient patterns:
- Design the export first. Align export field names to your template columns so you can load CSVs with Power Query or simple mapping macros.
- Bulk-download then filter. Export batches of comparable transactions instead of one-off downloads; filter and tag rows in Excel to create peer groups quickly.
- Pull pro-forma projections where available. Some platforms include acquirer/target pro forma numbers—these save time and reveal the seller’s disclosed assumptions.
- Validate with public filings. Use commercial data to speed collection but verify critical deal mechanics against the SEC filing or definitive merger agreement—don’t model off a single source without cross-checking.
Use automated linking when precision matters. Tools like Daloopa eliminate the export-map-verify loop entirely: install the Excel add-in, search for your target company, and retrofit data directly into your model template. The add-in maintains audit trails to source pages, so when a reviewer asks “where did this EBITDA figure come from?” you can show the exact 10-K page in seconds rather than hunting through saved PDFs.
Extracting Data From SEC Filings And Public Sources
When you must extract tables from PDFs or HTML filings:
- Search EDGAR for the filing (DEF 14A for proxy details on consideration or targetboard approvals; 8-K for executed merger agreements). Save the specific exhibit and note the exhibit page.
- Copy tables into Excel and immediately re-label headers to your standardized field names—don’t paste raw tables into final worksheets. Use Power Query to transform and keep a query that can be refreshed if the filing is amended.
- Extract purchase price components explicitly (cash, stock consideration, contingent consideration, assumed liabilities) and build a small reconciliation table so readers can see how you arrived at enterprise value.
This manual process is unavoidable when working with free sources, but it’s also where junior analysts lose the most time and introduce the most errors. If you find yourself repeatedly extracting the same data types from filings, consider whether a structured data platform would pay for itself in time saved and errors avoided.
Advanced M&A Data Analysis And Modeling In Excel
Once your data is tidy, you must make it persuasive. The goal is to create models that are fast to update, auditable, and tailored to stakeholder questions—because senior leaders don’t want to see your formulas; they want to see how sensitive the deal is to your three riskiest assumptions and whether the valuation holds if the market turns.
Standardizing And Normalizing Acquired Data
Raw exports will differ in naming conventions, fiscal calendars, and currency. Standardize immediately:
- Map every source field to your master field names.
- Convert currencies to a base currency using a dated FX table and tag which rate/date you used.
- Normalize fiscal year-ends: convert trailing twelve months to the same basis or use calendar-year equivalents depending on your comparables set.
Add validation controls that flag outliers (e.g., EV/EBITDA beyond a 2.5x interquartile range). Keep an exceptions log that explains why you kept or removed an outlier—auditors and senior analysts will thank you.
Daloopa automates much of this normalization by standardizing line items and fiscal periods before data ever reaches your model, which means you can skip the tedious mapping step and move directly to analysis.
Building Dynamic M&A Analysis Models
Structure your model so decision-makers can move from high-level conclusions to line-item justification in three clicks:
- Multi-method valuation – Include DCF, comparable companies, and precedent transactions on separate tabs, but drive all with the same core assumptions sheet so you can show why methods differ. This matters because boards often challenge single-method valuations; showing triangulation from multiple approaches builds confidence that you haven’t cherry-picked the method that supports your recommendation.
- Accretion / dilution module – Create a flow that starts with consideration, shows new share count, and produces pro-forma EPS under different funding mixes. Make this dynamic: toggle cash vs. stock and the model updates instantly. Why this matters: CFOs and boards care deeply about EPS impact, and being able to answer “what if we financed this with 30% stock instead of all cash?” in real-time during a meeting separates senior analysts from junior ones.
- Synergy modeling – Run separate schedules for revenue vs. cost synergies with ramp profiles (e.g., cost synergies 60% realized in Year 1, revenue over 3–5 years). Ground realization and ramp assumptions in consulting research, then stress-test them with sensitivity tables. Stakeholders want to see what happens if you only capture 50% of projected synergies, because history shows that overly optimistic synergy assumptions are the number-one cause of deal regret.
- Scenario & sensitivity tables – Build data tables (or use Tornado charts) that show how enterprise value, IRR, or EPS react to +/- ranges for revenue growth, margin expansion, or multiple compression. This “so what” is what senior stakeholders want—they need to see whether the deal still works if growth comes in 2 percentage points lower or if the exit multiple compresses. Don’t bury this analysis in a footnote; make it the centerpiece of your valuation summary.
Final Practical Checklist
- Build a Sources tab with the exact EDGAR link or database export file name for every major number.
- Always reconcile enterprise value calculation (consideration + assumed debt − cash) and show it line-by-line.
- Use named ranges for key drivers and protect formulas outside input zones to avoid accidental overwrites.
- Use consulting benchmarks for synergy timing and guard ranges with sensitivity analysis so senior leaders see the bounds of possible outcomes.
Sharpen Your M&A Workbench
Stop letting data collection slow your analysis. The difference between analysts who advance and those who stall often comes down to one thing: speed to insight. When you can turn a filing into a board-ready valuation in hours instead of days, you earn the trust that leads to bigger deals and more responsibility.
Speed your way from filing to insight by connecting reliable, auditable data directly into your models so you can spend your time on judgment, not cleanup. Explore Daloopa’s Excel workflows for M&A financial analysis and discover how source-linked datasets let you turn draft assumptions into board-ready outputs faster, with full audit trails that let you answer any “where did this number come from?” question in seconds rather than minutes.


