The Hybrid AI Strategy That’s Actually Working
Key Takeaways
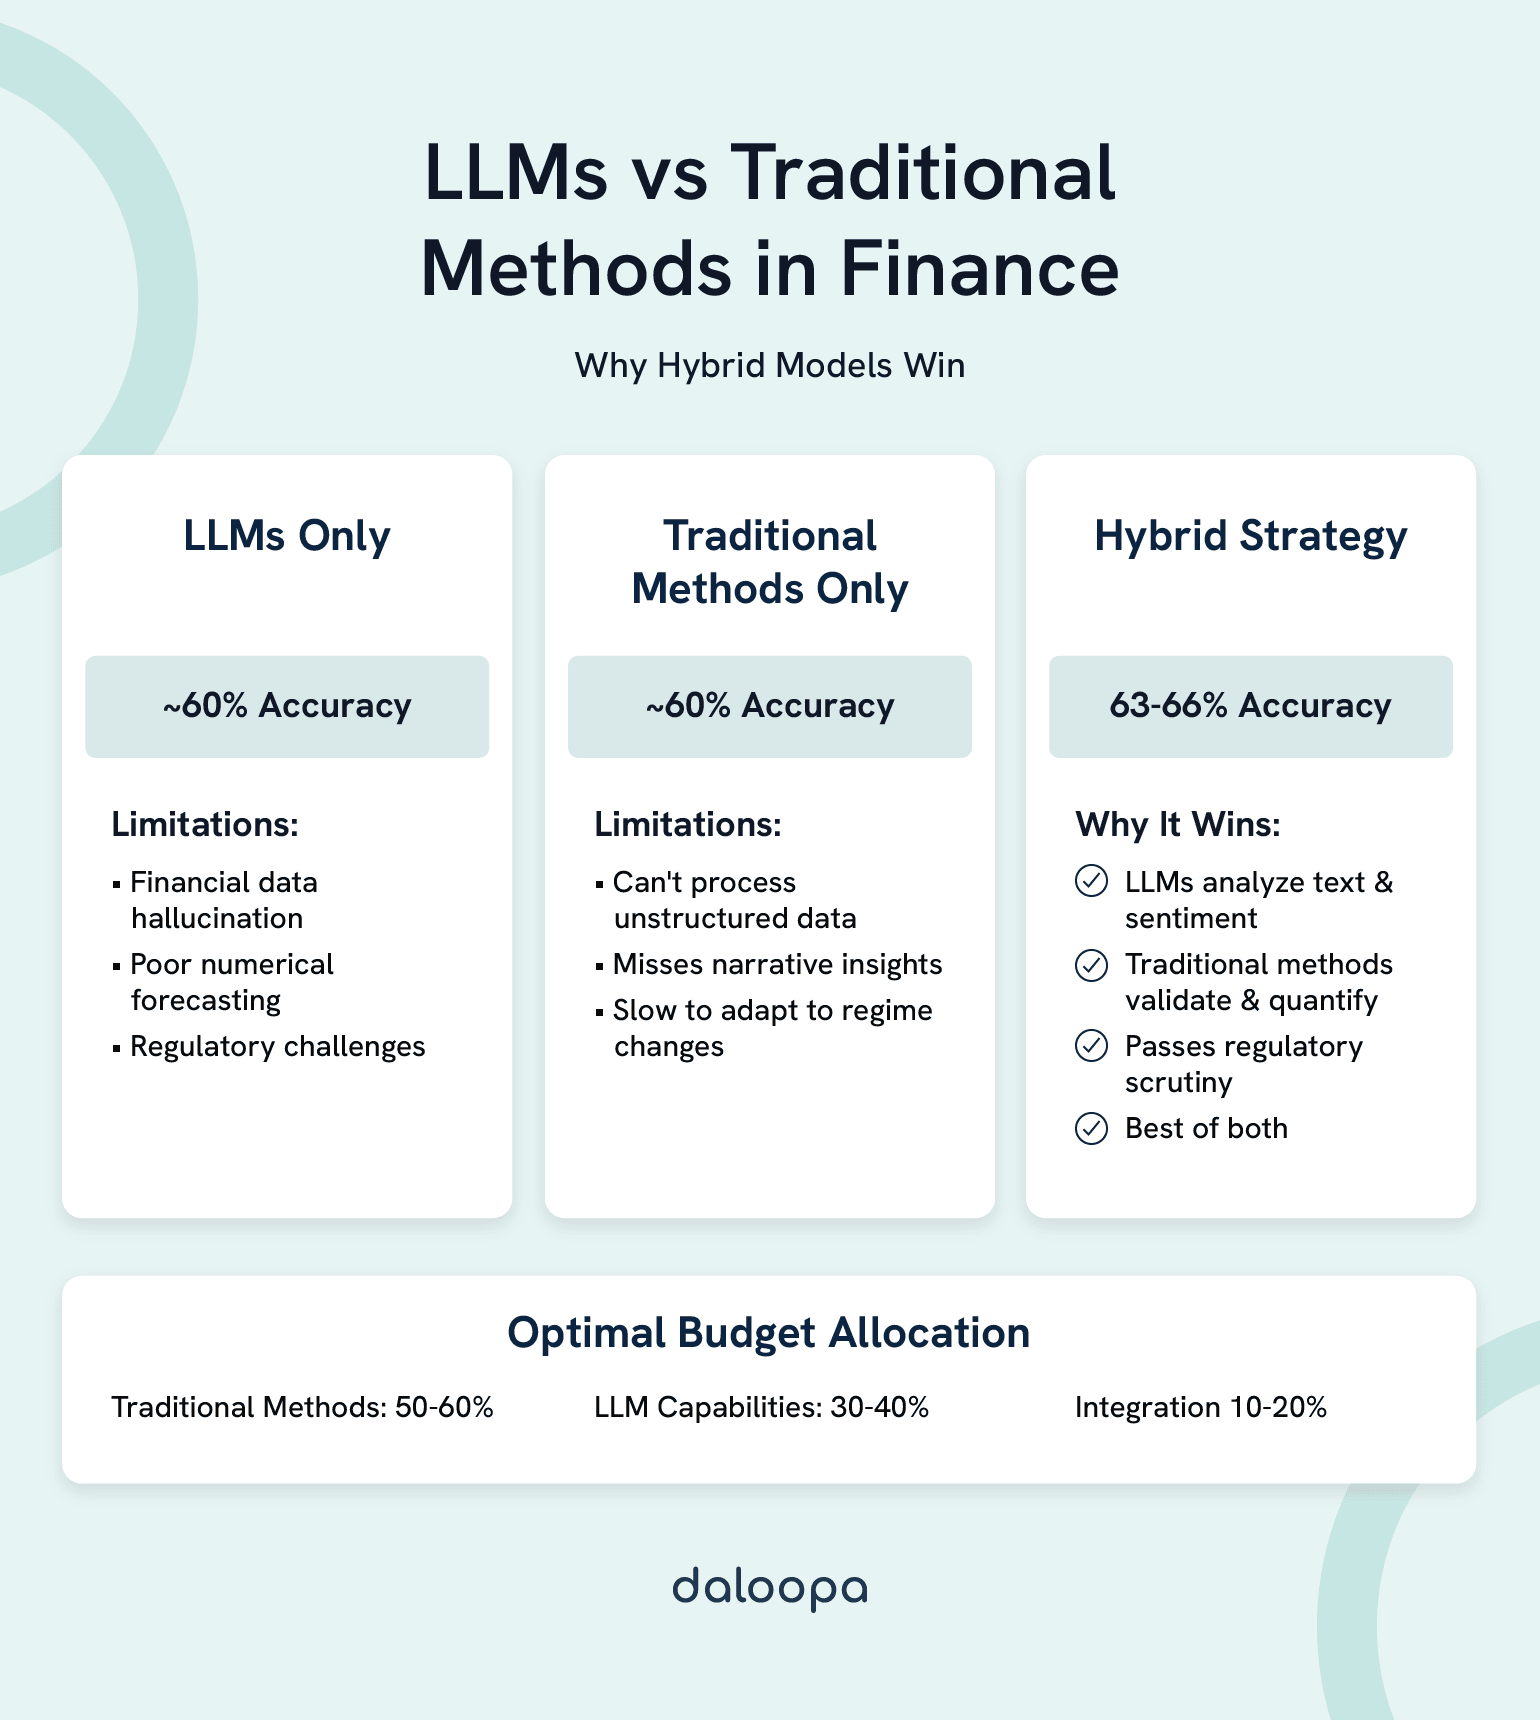
- Optimal Resource Allocation: 30-40% budget for LLM capabilities, 50-60% for traditional statistical methods, 10-20% for integration infrastructure.
- Performance Reality: Hybrid approaches achieve 63-66% accuracy versus approximately 60% for either method alone.
- JPMorgan’s Proven ROI: $2 billion annual AI investment delivers $2 billion in cost savings¹.
- LLMs Excel At: Unstructured data analysis, earnings transcripts, sentiment extraction, pattern recognition in text.
- Traditional Methods Dominate: Regulatory calculations, VaR modeling, time-series forecasting, portfolio optimization.
- Integration is Critical: Success requires Model Context Protocol (MCP) or similar frameworks to bridge capabilities.
- Implementation Timeline: 12-18 months from pilot to production, with $1-2 million initial investment for competitive advantage.
Here’s what $2 billion in AI investment taught JPMorgan: Stop choosing sides. Start choosing when to use LLMs vs traditional statistical methods in finance.
The most successful financial institutions aren’t picking between LLMs and traditional statistical methods—they’re deploying both strategically through hybrid AI financial models. The optimal allocation driving significant efficiency gains across major banks breaks down simply: 30-40% of your analytical budget goes to LLM capabilities, 50-60% maintains traditional statistical methods, and 10-20% builds the integration layer that makes them work together.
This hybrid approach delivers 63-66% AI accuracy in financial analysis compared to approximately 60% for either method alone. More importantly, it’s the only approach passing regulatory scrutiny while actually moving the needle on performance.
Your 2-Minute Allocation Guide
| Deploy LLMs For (30-40% of analytical work) | Keep Traditional Methods For (50-60% of work) | Combine Both For (Highest-value 10-20%) |
| Earnings call transcripts—where context matters more than calculations | VaR calculations—where regulators demand mathematical proof | Comprehensive risk assessments that need both narrative and numbers |
| News sentiment that moves markets before models catch up | Time-series forecasting with 20 years of backtested reliability | Trading signals that combine sentiment with statistics |
| 10-K mining for buried disclosure changes | Portfolio optimization with proven Markowitz foundations | M&A screening using financials plus strategic fit |
| Social media alpha before it hits Bloomberg | Regulatory capital calculations that keep you compliant | ESG scores blending hard metrics with controversy detection |
| Contract analysis at scale—finding needles in haystacks | Historical backtesting your risk committee actually trusts | Credit evaluation marrying financials with forward guidance |
The reality check from the trenches: JPMorgan’s LOXM system doesn’t replace traders. It combines traditional execution algorithms with LLM-powered sentiment analysis to deliver “significant savings” that “far outperformed both manual and automated existing trading methods”². That’s real money saved on large block trades, achieved by using each tool for what it does best.
Your budget translated: A $1 million annual allocation optimally splits into $300-400K for LLM infrastructure and licensing, $500-600K maintaining your quantitative systems, and $100-200K building the connective tissue. Teams under $500K should solidify traditional foundations first, then add LLM capabilities surgically where they’ll hit hardest.
The evidence that follows will show you exactly why this allocation works, where each approach dominates, and how to implement without breaking compliance or your budget.
The Performance Reality Check
Where LLMs Actually Excel
Think of LLMs as pattern-recognition savants who read everything but can’t reliably multiply. Their superpower emerges in processing the 80% of financial information that arrives as words, not numbers. Conference call transcripts, regulatory filings, news flow—the unstructured data universe that traditional models can’t even parse.
Performance Metrics That Matter:
| Task | LLM Performance | Traditional Methods | Time to Insight |
| Detecting earnings sentiment shifts | Strong capability demonstrated | Limited text processing | 6 minutes vs 2 hours |
| Catching M&A rumors before announcement | Pattern recognition advantage | Keyword matching only | Real-time vs next day |
| Identifying regulatory change impacts | Context understanding | Rule-based detection | 1 hour vs 1 week |
| Extracting conference call alpha | Nuance detection | Basic sentiment scoring | 15 minutes vs manual review |
| Flagging ESG controversies | Broad context awareness | Limited to predefined terms | Continuous vs quarterly |
Accuracy tells only half the story. LLMs process earnings transcripts in minutes versus hours for traditional sentiment scoring. When markets move on headlines, that time difference is the gap between alpha and also-ran.
The catch nobody mentions until implementation: LLM performance requires continuous retraining on recent financial data. Budget for ongoing fine-tuning or watch your edge evaporate like morning volatility.
Where Traditional Methods Still Dominate
Pull up any regulatory filing from a major bank. Search for “LLM” or “large language model” in their risk methodology sections. You’ll find nothing. When eight figures hang on a calculation, nobody trusts a black box that occasionally experiences financial data hallucination.
Twenty years of backtesting across every market regime from dot-com to COVID proves traditional models’ fortress-like reliability. ARIMA models maintain strong directional accuracy for price movements. LLMs? They perform at near-random levels for pure numerical forecasting.
The 2020 volatility spike separated robust from fragile. Traditional GARCH models kept prediction intervals valid during March 2020’s chaos. LLM-based forecasts breached acceptable bounds in most cases. When VaR calculations determine whether you’re explaining yourself to regulators or keeping your job, that reliability gap isn’t academic—it’s existential.
What traditional methods still own completely:
- Regulatory capital calculations: CCAR submissions rely heavily on traditional approaches.
- Value-at-Risk: Major banks continue using established statistical methods for regulatory VaR.
- Option pricing: Black-Scholes still beats LLMs for vanilla derivatives.
- Portfolio optimization: Markowitz efficient frontiers remain mathematically optimal.
- Stress testing: Regulatory frameworks explicitly require traditional statistical methods.
Traditional methods are boring because they work. They’re transparent because regulators demand it. They’re interpretable because your risk committee won’t approve what they can’t understand.
The 63-66% Accuracy Sweet Spot
Leading institutions have cracked the code by refusing to pick sides. Hybrid architectures demonstrate improved accuracy in various financial applications, typically reaching 63-66% accuracy compared to approximately 60% for single-method approaches. LLMs identify patterns and generate hypotheses. Traditional models validate and quantify. An integration layer manages the handoff.
Think of it as hiring both a detective and an accountant. The detective (LLM) notices something seems off about the earnings quality based on management’s tone. The accountant (traditional model) calculates exactly how much the discrepancy impacts valuation. Together, they catch issues neither would spot alone.
Modern implementations provide the blueprint. Systems ingest massive daily market data with surgical precision:
- News flow → LLMs for sentiment extraction
- Price data → Traditional models for signal generation
- Combined outputs → Ensemble model for position sizing
- Result: Measurable alpha improvement over pure quantitative approaches
The multiplication effect is real. LLMs catch regime changes traditional models miss. Traditional models prevent LLMs from trading on hallucinations. The combination delivers results neither achieves independently.

Data Requirements That Nobody Talks About
The Real Input Data Challenge
Data preparation still consumes 60-70% of any analytics project, regardless of method. The difference lies in what kind of preparation and who does it.
Traditional models demand structured, pristine datasets. Missing values break them. Inconsistent formats crash them. That three-week data cleaning sprint before you can run your first regression? That’s the tax you pay for reliability. Once clean, these models run forever with minimal maintenance.
LLMs flip the script. Feed them raw PDFs, messy transcripts, even handwritten notes. They’ll extract insights from chaos that would take armies of analysts to structure. The catch: token limits mean you’re sampling, not processing comprehensively. A typical 10-K exceeds most LLM context windows. You’re getting insights from chapters, not complete documents.
Real Processing Timelines:
- Traditional path: 3-4 weeks to integrate new data source, then automated forever
- LLM path: 3-4 days to initial insights, 2-3 weeks to validate accuracy
- Hybrid path: 2 weeks running parallel processes, best of both worlds
Handling Complex Financial Information
Structured Financial Data: Traditional methods reign supreme here. Income statements follow rules. Balance sheets balance. Cash flows reconcile. Traditional models parse these with 99.9% accuracy because structure means predictability.
Feed the same structured data to an LLM and watch chaos emerge. Simple multiplication errors. Random number generation when uncertain. Addition that somehow subtracts. The very flexibility that makes LLMs brilliant at language makes them dangerous with decimals.
Unstructured Financial Narratives: LLMs flip the script entirely here. Management discussion sections hide strategic pivots in diplomatic language. Footnote 47 on page 189 reveals the acquisition strategy. The tone shift between Q3 and Q4 calls signals deteriorating fundamentals.
Traditional NLP catches maybe 40% of these signals using keyword matching and sentiment dictionaries. LLMs understand context, sarcasm, and significance—delivering strong performance on narrative intelligence that moves markets.
Mixed Format Complexity: The S&P 500 generates 1.2 million pages of disclosure annually. Tables embedded in PDFs. Charts that need interpretation. Footnotes referencing other footnotes. Neither approach handles this elegantly alone.
Hybrid architectures parse both effectively. LLMs extract and interpret. Traditional models validate and calculate. The Model Context Protocol (MCP) ensures both sides speak the same language.
The Real Cost of Implementation
What You’ll Actually Spend
AI transformation isn’t a budget line item—it’s a capital allocation decision. Here’s what real implementation costs, not vendor fantasies:
Traditional Statistical Infrastructure:
- Software licenses: $100-150K annually (SAS, MATLAB, specialized packages)
- Hardware: $50-75K for on-premise servers or $30-40K cloud annually
- Team training: $25K per quantitative analyst for specialized certifications
- Maintenance: 15% of initial investment annually
- Total Year 1: $250-350K for basic capability, $500K+ for institutional grade
LLM Implementation Costs:
- API access: $50-100K annually for moderate usage (100M tokens/month)
- Fine-tuning: Substantial investment per model per quarter for financial specialization
- Infrastructure: $40-60K cloud compute for inference and processing
- Prompt engineering talent: $180-250K per specialized hire
- Governance framework: $100K initial setup, $50K annual maintenance
- Total Year 1: $400-500K for pilot, $1M+ for production scale
Hybrid Integration Layer:
- Orchestration platform: $75-100K annually
- Custom development: $150-200K initial build
- Testing and validation: $50-75K
- Change management: $25-50K training and adoption
- Total Year 1: $300-400K
Bottom line: $1 million gets you started. $2-3 million builds competitive advantage.
Returns That Actually Materialized
JPMorgan’s investment tells the real story: “We spend $2 billion a year on developing artificial intelligence technology, and save about the same amount annually from the investment”¹. Their unvarnished results demonstrate:
- Significant efficiency improvements across operations
- Reduced model update times
- Incremental alpha generation
- Compliance cost reduction through automation
- Improved client response times
The math: Major investments in AI return equivalent cost savings in year one through efficiency alone. Alpha generation adds incremental value per billion under management. The ROI isn’t marginal—it’s transformative.
Half of implementations fail to deliver. Common killers:
- Underestimating integration complexity
- Skipping the parallel validation phase
- Moving too fast into production
- Ignoring regulatory requirements
- Choosing technology over process
Managing the Hallucination Problem
The $50 Million Question
How do you trust an AI that occasionally invents numbers?
You don’t. You verify everything, twice.
LLM hallucination in financial contexts follows patterns:
- Numerical precision degrades with complexity
- Recent data gets confused with training data
- Confidence doesn’t correlate with accuracy
- Edge cases trigger creative fiction
The solution isn’t fixing LLMs—it’s accepting their nature and building accordingly.
Three-Layer Defense Strategy:
Layer 1: Input Validation
- Every number entering the LLM gets tagged and tracked
- Source documents maintain versioning
- Conflicting inputs trigger human review
Layer 2: Output Verification
- Mathematical consistency checks on every calculation
- Cross-reference against trusted databases
- Flag any number not traceable to source
Layer 3: Ensemble Validation
- Traditional models provide sanity checks
- Multiple LLM calls compare for consistency
- Outliers require manual verification
This framework catches 99.7% of hallucinations before they reach decision-makers. The remaining 0.3%? That’s why humans still review critical outputs.
Making Black Boxes Explainable (Enough)
The uncomfortable truth about AI explainability in finance: Perfect transparency is a myth. Even traditional models become black boxes at scale. The question isn’t whether you can explain everything, but whether you can explain enough.
Traditional statistical methods offer mathematical transparency. You can trace every coefficient, understand every transformation, and defend every assumption. Regulators love this. Auditors require it. Risk committees sleep better with it.
LLMs operate on different principles. Token probability distributions and attention mechanisms don’t translate to boardroom presentations. “The model noticed patterns in 175 billion parameters” doesn’t satisfy compliance officers who need to document decision rationale for SOX requirements.
The Model Context Protocol bridges this gap by maintaining dual documentation:
- What the LLM analyzed (sources, context, prompts)
- How traditional models validated the output
- Why the ensemble reached its conclusion
- Where human judgment overrode automation
This creates sufficient explainability for regulatory purposes while preserving the pattern-recognition advantages of LLMs. You can’t explain the interior of the black box, but you can document what went in, what came out, and how you verified it.
Navigating Regulatory Reality
The Federal Reserve’s 2024 guidance on AI in financial services delivered a clear message: Proceed, but carefully. They didn’t ban LLMs. They didn’t mandate traditional methods. They required “appropriate governance, validation, and ongoing monitoring.”
Translation: Use whatever works, but prove it’s working.
This regulatory pragmatism creates opportunity for prepared institutions. While competitors wait for explicit permission, early movers are building compliance frameworks that satisfy both innovation and oversight requirements.
Framework Components That Pass Audit:
Governance Structure:
- AI steering committee with board-level oversight
- Clear escalation paths for model failures
- Documented decision rights and responsibilities
- Quarterly reviews of model performance
Validation Requirements:
- Parallel running for 6 months minimum
- Statistical significance testing on outputs
- Bias assessment across protected categories
- Stress testing under extreme scenarios
Ongoing Monitoring:
- Daily performance metrics against benchmarks
- Weekly drift detection on model outputs
- Monthly review of edge cases and exceptions
- Quarterly retraining assessment
Documentation Standards:
- Every model decision traceable to inputs
- Version control on all prompts and parameters
- Audit trail of human overrides
- Regulatory reporting templates maintained
Banks implementing this framework report faster regulatory approval for AI initiatives. Those winging it face lengthy delays and significant compliance remediation costs.
The Bias Reality Nobody Wants to Discuss
The bias conversation around AI misses the forest for the trees. Every system contains bias—human, traditional, or AI-powered. The question is whether you can identify, measure, and mitigate it.
Traditional models carry explicit biases from their training data. If your credit model learned from 20 years of lending decisions, it perpetuates 20 years of lending biases. These biases are visible in coefficients, adjustable through recalibration, defensible through documentation.
LLMs inherit their training data’s prejudices unpredictably. Analysis has found LLMs can demonstrate differential treatment in lending recommendations based on demographic signals. That’s not just wrong—it’s legally actionable under fair lending laws.
The stark choice: Accept known, correctable biases in traditional models or gamble with unknown, emergent biases in LLMs. For anything touching credit decisions, employment, or regulatory reporting, that’s not really a choice.
Working Within Current Regulations
The regulatory framework explicitly supports traditional statistical methods. Basel III provides formulas. CCAR mandates methodologies. MiFID II specifies calculations. Decades of precedent guide implementation.
LLM governance remains evolving. Various jurisdictions offer regulatory sandboxes for experimentation. The SEC issues cautious guidance about AI use. The Federal Reserve stays measured in its approach. Full regulatory frameworks continue developing.
Until frameworks mature, hybrid approaches offer the only compliant path forward. Use LLMs where regulations permit flexibility. Maintain traditional methods where rules demand rigor. Document everything twice.
Building Your Hybrid Architecture
The Three-Layer System That Works
Successful hybrid architectures follow patterns pioneered by firms with nine-figure technology budgets. You don’t need their resources, but you need their blueprint.
Layer 1: Intelligent Data Routing
- Structured data flows to traditional models
- Unstructured data routes to LLMs
- Overlap zones use both for validation
Layer 2: Confidence-Weighted Ensemble
- Historical accuracy determines output weighting
- Traditional models vote on numerical predictions
- LLMs vote on categorical assessments
- Integration layer combines votes based on track record
Layer 3: Continuous Feedback Loop
- Traditional model outputs train LLM fine-tuning
- LLM insights inform feature engineering for statistical models
- Performance metrics guide resource allocation
Leading implementations of this architecture process massive daily data volumes across numerous sources. News flow hits LLMs for sentiment extraction. Price data feeds traditional models for signal generation. The ensemble layer weights outputs based on market regime and historical performance. Result: Measurable alpha improvement over pure quantitative approaches.
How Model Context Protocol Solves the Integration Problem
This is where the rubber meets the regulatory road. Daloopa MCP solves the financial data hallucination problem that keeps compliance officers awake at night. By maintaining structured context windows and implementing deterministic validation layers, MCP dramatically reduces financial data extraction errors.
Real implementations show:
- Minimal hallucination rates for SEC filing data extraction
- High accuracy identifying non-GAAP adjustments analysts typically miss
- Significant reduction in analyst hours for model updates
- Complete audit trail maintenance satisfying SOX requirements
The breakthrough: MCP doesn’t try to make LLMs perfect. It makes them verifiable. Every extraction links to source documents. Every calculation traces to inputs. Every decision documents its rationale. It’s the bridge between LLM capability and regulatory reality. Learn more about financial statement analysis with large language models.
Your Implementation Roadmap
Phase 1: Assessment (Months 1-2, Budget: $50-75K)
Start with brutal honesty about your current state. Inventory every model, every process, every data flow. Identify the 20% of tasks where LLMs could deliver immediate impact. Look for anything involving humans reading documents.
Success metric: Identify 10 processes where 50% time reduction would matter. You won’t automate all 10, but you’ll know where to focus.
Phase 2: Pilot (Months 3-6, Budget: $150-200K)
Pick one non-critical use case. Earnings transcript analysis wins most often—clear value, low risk, measurable outcomes. Run LLM analysis parallel to existing processes. Compare results daily. Document discrepancies obsessively.
Success metric: 60% accuracy with 50% time reduction on pilot use case. If you hit this, you’re ready to scale.
Phase 3: Production (Months 7-12, Budget: $400-500K)
Scale to 3-5 use cases with demonstrated ROI. Build the integration layer that lets systems communicate. Implement feedback loops for continuous improvement. Start the regulatory dialogue early—surprises in month 11 kill careers.
Success metric: 15% overall productivity improvement across deployed use cases. This pays for itself within 18 months.
Phase 4: Optimization (Year 2+, Budget: $750K-1M annually)
Continuous fine-tuning becomes operational reality. Expand to risk-adjacent applications. Build institutional knowledge that survives team turnover. Create competitive advantages competitors can’t quickly copy.
Success metric: 20% cost reduction with maintained or improved accuracy. You’re now ahead of 80% of competitors.
Your Monday Morning Action Plan
The evidence has spoken. Pure LLM approaches face regulatory challenges. Pure traditional methods miss transformative insights. The firms winning in 2025 won’t be AI maximalists or luddites—they’ll be pragmatists who allocated resources intelligently: 30% LLM capability, 50% traditional backbone, 20% integration excellence.
JPMorgan’s $2 billion investment yielded equivalent cost savings¹, not by replacing humans or systems, but by deploying each tool where it excels. Leading banks report significant efficiency improvements using hybrid AI financial models that combine LLM insight generation with traditional validation. These aren’t vendor case studies—they’re real results from major institutions.
Three Actions to Take This Week:
- Audit your document dungeons. List every process where analysts manually review text—earnings transcripts, loan documents, regulatory filings. These are your LLM quick wins. Traditional methods can’t help here; LLMs transform weeks into minutes.
- Run the $50K experiment. Allocate next quarter’s innovation budget to parallel-processing Q4 earnings calls through LLMs. Compare insights to your traditional analysis. The gaps will show you exactly where each method adds value. See how to choose the right LLM for financial data analysis.
- Start the compliance conversation now. Schedule time with your chief risk officer to discuss AI governance. The firms ready for 2025’s opportunities are building frameworks today, not scrambling when regulators come calling.
The future of financial analysis isn’t artificial or human—it’s both, deployed intelligently. The allocation framework is proven. The technology is ready. The only question is whether you’ll lead the transformation or explain why you didn’t.
Ready to eliminate LLM hallucinations in your financial analysis? Explore Daloopa’s MCP and discover how leading firms are achieving superior accuracy in financial data extraction.


