
Making the wrong investment decision costs more than just money. It shakes your confidence and slows your progress.
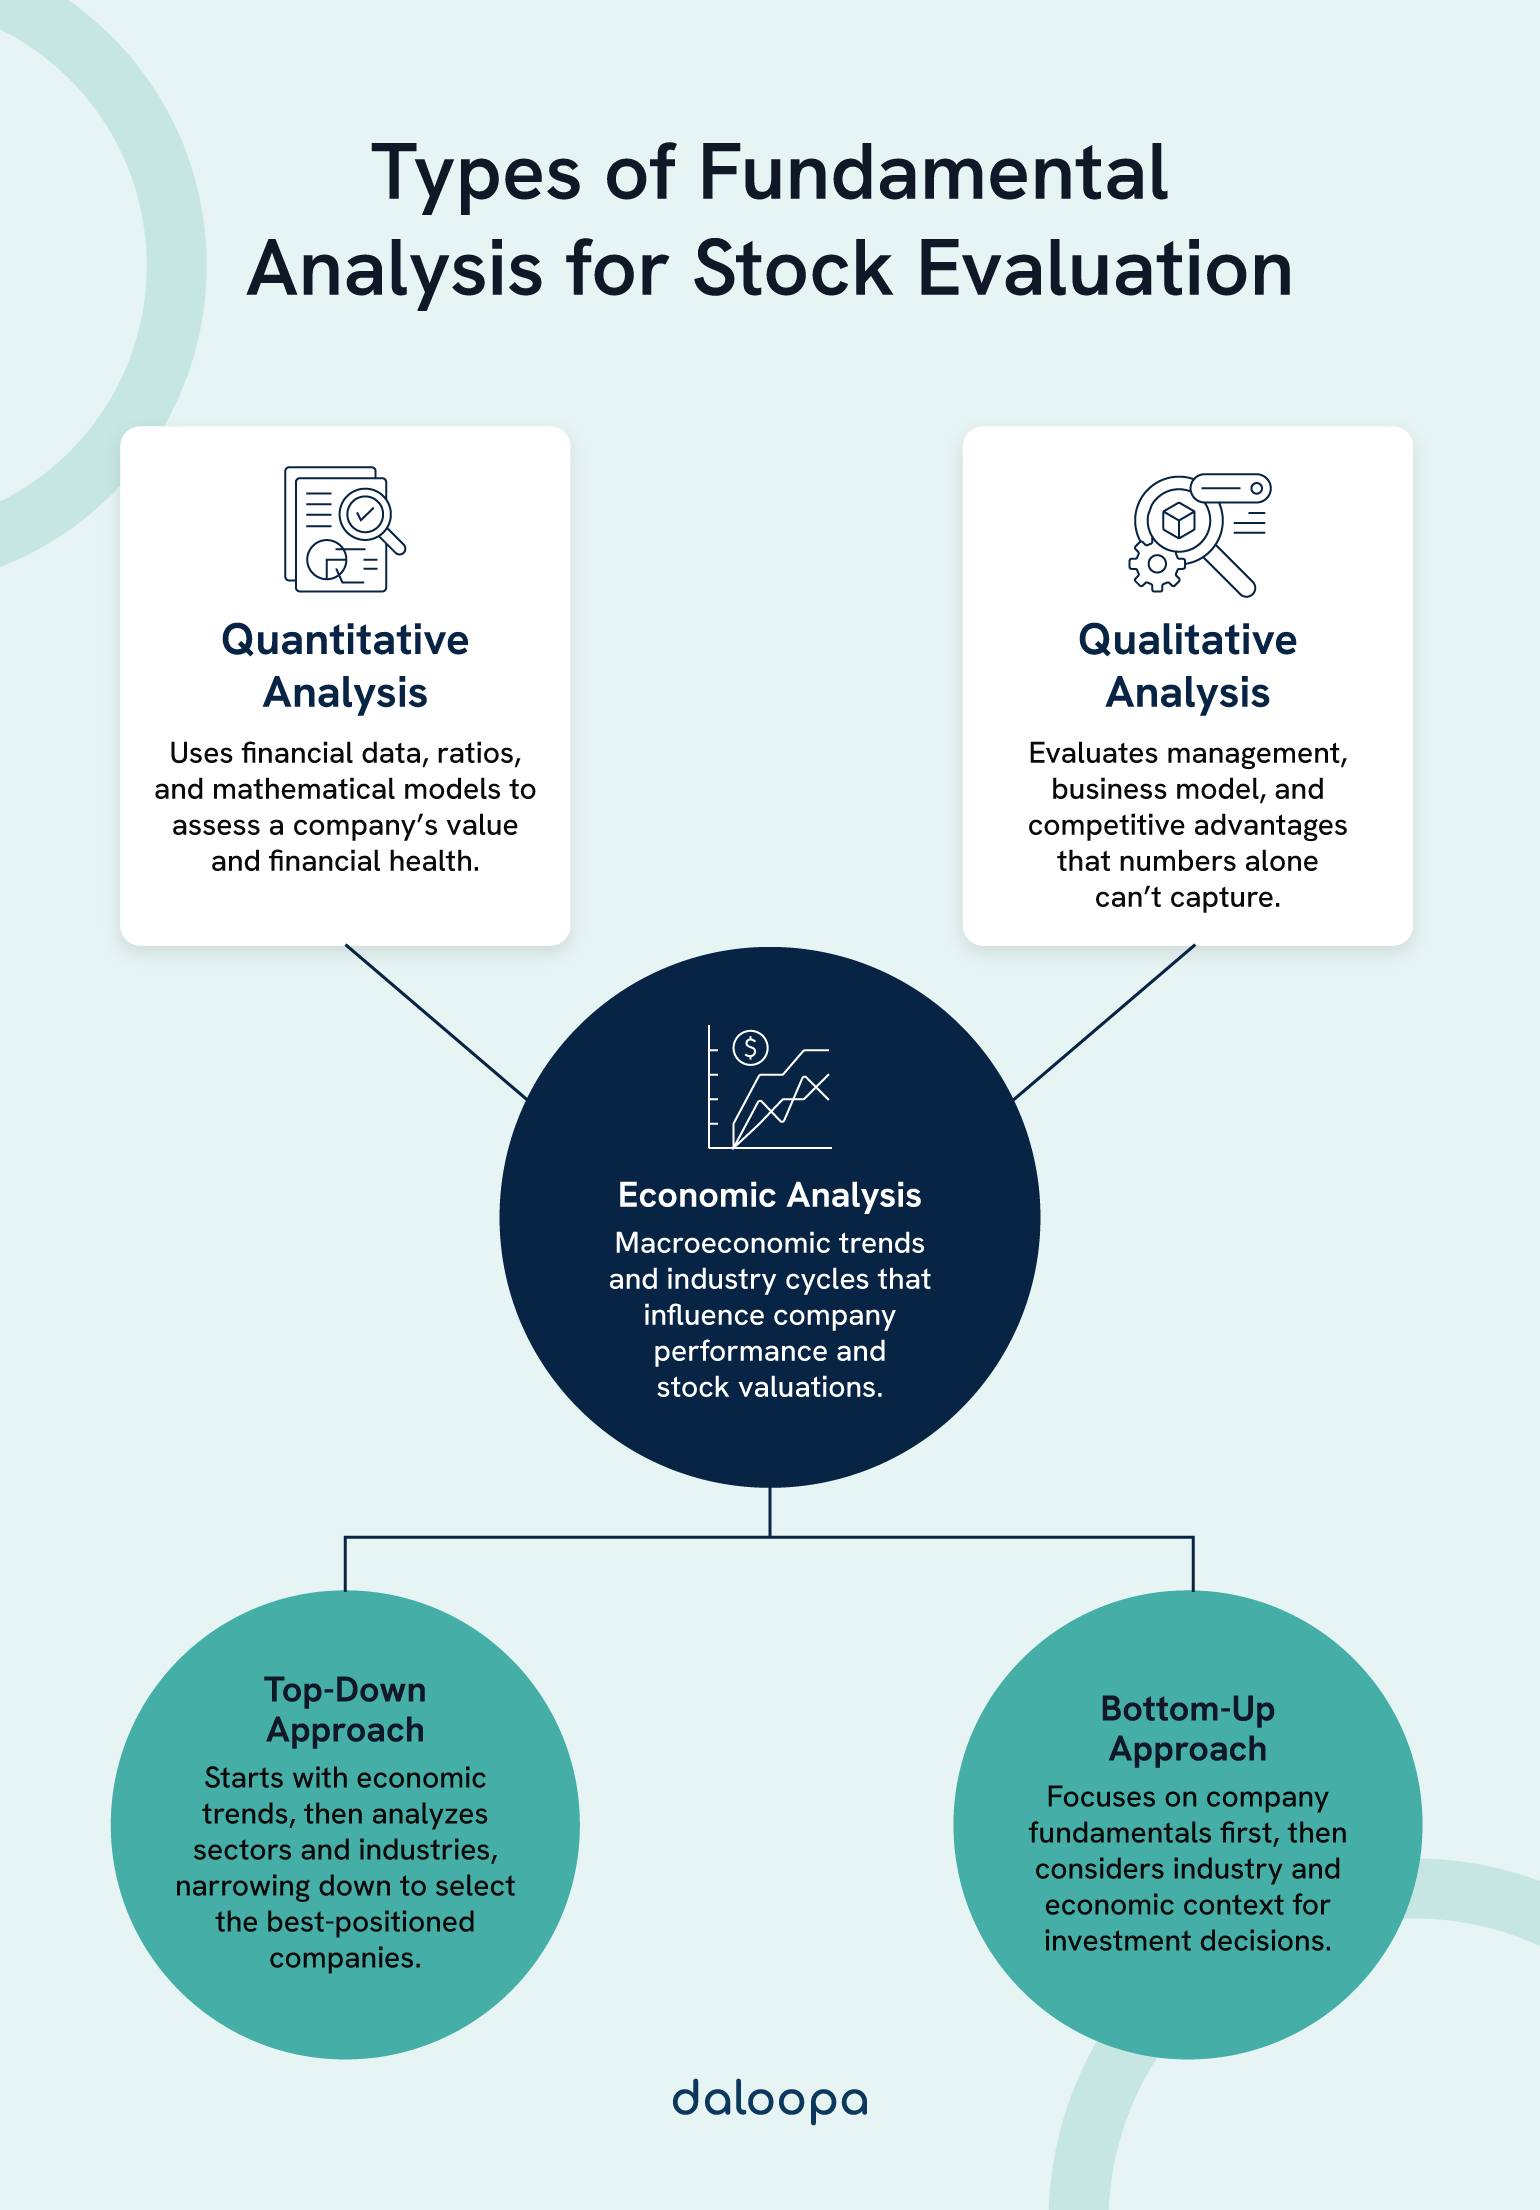
Fundamental analysis helps you assess a company’s real value based on financial facts, business performance, and broader economic conditions. This kind of analysis goes deeper than surface-level metrics. It looks at everything from earnings reports and cash flow to industry trends and leadership quality. The goal is to figure out whether a stock is actually worth its price or if it’s riding a wave it can’t sustain. Each fundamental analysis approach plays a distinct role. Together, these types of fundamental analysis methods offer a clear, structured view of a company’s long-term potential. Investors who use them consistently are better positioned to make informed decisions, avoid emotional reactions, and stay focused on value over noise.
Key Takeaways
- Fundamental analysis blends measurable quantitative data with qualitative insights to reveal underlying value.
- Company reports and economic signals form the backbone of a rigorous assessment.
- Using a variety of analytical tools together results in more thorough, accurate stock evaluations.
Quantitative Fundamental Analysis
Quantitative methods represent one of the key fundamental analysis methods, focused on turning data into insight. Quantitative analysis is all about the numbers. It uses mathematical tools and statistical logic to make sense of financial data and assess whether a stock’s current price reflects its actual value. When markets are volatile or overhyped, this approach keeps your decisions rooted in measurable facts.
Financial Statement Analysis
Among the various types of fundamental analysis, financial statement analysis remains a cornerstone method for evaluating real financial health. The key documents here are the income statement, balance sheet, and cash flow statement, each one offering a different lens into a company’s financial health.
Income statements can reveal whether a business is consistently improving or struggling to maintain momentum. Look for rising revenues paired with declining margins; often a sign of growing costs or pricing pressure that could hurt long-term viability. In a turnaround situation, improving margins may be the first sign the business is getting back on track.
Balance sheets give a snapshot of its stability and how much financial flexibility it has. If you’re evaluating a stock for a long-term retirement portfolio, a strong balance sheet signals resilience during economic downturns. But excessive cash without a clear reinvestment plan might also point to poor capital allocation.
Positive operating cash flow is a strong signal that day-to-day operations are functioning well and support future growth. Watch for large discrepancies between net income and operating cash flow. That’s often where accounting tricks hide. For income investors, healthy free cash flow can also indicate the sustainability of dividend payouts.
Ratio Analysis
Ratios turn raw data into insights. They help investors quickly assess whether a company is doing well or if it might be overextended.
The price-to-earnings (P/E) ratio compares a company’s stock price to its earnings, offering a sense of whether the stock is fairly priced. In mature industries, a low P/E might signal an undervalued opportunity or a red flag if future growth is drying up. Compare against sector norms to avoid misreads.
Liquidity ratios, like the quick ratio, measure a firm’s ability to pay near-term obligations. A value above 1.0 generally means the company is on solid footing. For investors holding small caps or speculative plays, strong liquidity is key. It shows the company can survive bumps in the road without having to dilute shares or raise expensive debt.
Debt-to-equity ratios reveal how much debt a company is using to fund operations. A lower ratio often reflects less financial risk. But in capital-intensive sectors like utilities or telecom, some debt is expected. The risk lies in whether debt is supporting growth or just propping up weak performance.
Return on equity (ROE) shows how effectively the company uses investor money to turn a profit. Strong ROE signals competent leadership and smart capital deployment. When comparing ROE, watch for inflated numbers driven by high debt levels. It’s not just about the return, but how it’s achieved. In founder-led companies, unusually high ROE often reflects efficient, focused leadership.
Valuation Models
Discounted cash flow (DCF) analysis forecasts future cash earnings and adjusts them for today’s value, helping investors see what a company is worth now. DCF is powerful but sensitive. Small changes in growth rate or discount assumptions can swing the outcome wildly. Use it to pressure-test best-case vs worst-case scenarios, especially when growth is speculative.
The dividend discount model focuses on dividend-paying stocks. It estimates value based on the present worth of expected future dividend payments. This model is ideal for income-focused investors, particularly retirees. But if dividend growth slows or payouts are cut, the model quickly loses its predictive power. Watch payout ratios and cash flow trends closely.
Comparables analysis looks at companies in the same space. By comparing valuation multiples like P/E or price-to-sales, investors can quickly spot mispriced stocks. It’s useful when entering a sector you’re less familiar with. But beware of applying peer multiples blindly. Look deeper to see if the “cheap” stock has hidden issues or if the “expensive” one just has better fundamentals.
Advanced Quantitative Methods
Machine learning helps crunch massive amounts of financial and market data to surface hidden patterns. These models often spot trends that human analysts may overlook. In fast-moving markets, this can give institutional investors an edge, though retail traders should be cautious of black-box models without understanding the inputs.
Statistical arbitrage looks for temporary price differences between related stocks or assets. This technique relies on rapid data processing and tight execution. It’s most useful in short-term, high-frequency environments, outside the wheelhouse of most retail investors. Still, understanding when these strategies are active can help explain odd price movements in large-cap pairs.
Risk modeling draws on historical data to simulate potential losses and stress test portfolios. Metrics like beta and value at risk (VaR) give a more precise sense of exposure. When you’re managing a portfolio that needs to weather interest rate hikes or geopolitical shocks, risk modeling helps you prepare rather than react.
Screening tools use layered quantitative filters, such as revenue growth, profit margins, or valuation ratios, to narrow the field to only those companies that meet specific goals. For self-directed investors, screening tools cut through noise. But the real edge comes from digging into the outliers, not just the companies that look good on paper.
Qualitative Fundamental Analysis
While numbers matter, a company’s long-term success often hinges on factors you can’t quantify with a formula. That’s where qualitative analysis comes in. It’s the part of analysis that demands judgment, intuition, and a real understanding of how businesses win or fail in the real world.
Business Model Assessment
The way a company makes money tells a lot about its staying power. Look at how it generates revenue, serves customers, controls costs, and builds strategic alliances.
Scalability is another big factor. If a company’s model can grow without ballooning costs, it stands a better chance of building long-term value.
When you’re building a portfolio meant to fund your kids’ education or support your retirement, you want companies whose growth won’t collapse under its own weight. Think about what happens when a business scales fast but can’t keep margins in check. Profits disappear and the stock tanks.
The main points of focus include:
- Core revenue streams and how dependable they are
- What makes the company useful or desirable to customers
- How its products or services reach the market
- Efficiency in delivering those offerings
- Collaborations and partnerships that create leverage
Management Evaluation
Leadership makes or breaks strategy. A good management team turns plans into progress. That’s why we look at credentials, experience, and results.
Beyond resumes, track how leaders communicate with investors and how closely their compensation aligns with long-term performance. If you’re relying on a company to carry part of your financial future, you want leaders who think beyond the next quarter. Tone, transparency, and strategy execution all matter.
Also consider:
- Their track record in current and past roles
- Whether they have a clear, realistic vision and can act on it
- How well they engage with shareholders and the public
- How much skin they have in the game through stock ownership
- Pay packages and whether incentives align with investor interests
Competitive Landscape Analysis
Even a solid company can struggle if it’s in a tough industry or facing powerful rivals. That’s why context matters. A great product doesn’t guarantee survival. Market dynamics can wipe out even well-run businesses if they’re outmatched or too slow to adapt.
Examine the company’s edge, like strong branding, exclusive patents, or network effects. These advantages make it harder for newcomers to steal market share. Ask yourself: If a new player entered the market tomorrow, how easily could they chip away at this company’s position? That’s the kind of threat every investor should care about.
Look at the following factors:
- How much of the market a few big players control
- Whether new competitors can enter easily
- The company’s pricing flexibility
- Shifts in market share over time
- Brand awareness and loyalty levels
Economic Fundamental Analysis
The broader economy shapes the playing field for every investor. Economic analysis helps us understand how interest rates, inflation, and global events affect company performance.
Macroeconomic Indicators
Interest rates affect both what companies pay to borrow and how much investors can earn elsewhere. Central bank decisions ripple through all asset classes.
When rates rise, highly leveraged businesses face ballooning costs, and dividend stocks can suddenly look less attractive than safer fixed-income alternatives. Knowing how a company’s debt profile intersects with interest rate trends is a sharp edge.
GDP signals how fast the economy is growing or shrinking. When GDP rises, businesses usually earn more, and stock prices tend to climb. But don’t stop at the headline number. Drill down into which sectors are contributing to growth. A high-GDP quarter fueled by tech may not help your industrial stock much.
Also monitor:
- Inflation and cost-of-living trends
- Job numbers and how wages are changing
- Productivity in the goods and services sectors
- Consumer sentiment, which predicts spending behavior
Industry Analysis
No two sectors react the same way to economic shifts. Some flourish in boom times; others offer stability when things slow down. Observe how different sectors perform across economic cycles.
For instance, when inflation hits, consumer staples often hold their ground while luxury brands stumble. In a downturn, utilities and healthcare may shine. Understanding industry cycles helps you zig when others zag.
Consider how concentrated each market is, whether firms face high startup costs, and how demand trends affect pricing. In capital-heavy industries like telecom or oil, a small rate hike can crush expansion plans. Meanwhile, industries with low entry barriers may flood with competition when growth looks good.
Key aspects to analyze:
- How market share is distributed across players
- Regulatory influence or constraints
- Supply chain strengths and weak points
- Where each industry sits in its maturity curve
Global Economic Factors
Global events can move markets just as much as domestic ones. Trade, currency strength, and geopolitical changes all influence growth opportunities.
For example, when the dollar strengthens, it becomes tougher for U.S. exporters to compete. Conversely, it makes imports cheaper for U.S. consumers and businesses. And major policy changes abroad, like trade agreements or regulatory shifts, can disrupt supply chains or open new markets.
Investors who spotted early tensions in global shipping lanes, for instance, were able to shift into logistics and energy stocks ahead of supply shocks.
Track things like:
- How fast other regions are expanding or contracting
- Central bank moves outside the U.S.
- Where money is flowing across borders
- Trade disputes, alliances, and access to foreign markets
Integrated Approach to Fundamental Analysis
To get a complete view, investors often blend different types of fundamental analysis. This integrated approach connects the dots between macro trends, industry shifts, and company specifics.
Top-Down Analysis
Start broad, then zoom in. That’s the heart of top-down fundamental analysis. As one of the primary fundamental analysis methods, it ensures decisions are shaped by economic context. It begins with the big picture—global trends, inflation, interest rates—and then filters down.
Once you understand the wider environment, pinpoint industries likely to benefit. From there, look for standout companies within those spaces.
When you’re building a portfolio meant to withstand recession shocks or capitalize on a boom, this approach helps you ride the right wave without guessing. You’re not just asking, “Is this a good company?” You’re asking, “Is this a good company right now, in this climate?”
The steps include evaluating:
- GDP growth and inflation pressures
- Interest rate direction and policy signals
- Sector-specific factors like demand cycles and regulation
Bottom-Up Analysis
As one of the foundational fundamental analysis methods, the bottom-up approach is ideal for those who believe great businesses can thrive even in difficult economies. This starts at ground level. Investors study individual companies first, focusing on financial results, business strategies, and durable advantages. It’s about identifying strong players even in weaker sectors.
This is the strategy behind finding the next breakout stock while everyone else is still doom-scrolling economic forecasts. Even in a down market, bottom-up thinkers can spot quality hiding in plain sight.
Key elements of this approach:
- Revenue consistency and margin trends
- Balance sheet strength and ROE
- Clarity of leadership and governance
- Stock price versus fundamental value using classic models
Hybrid Analytical Frameworks
Some of today’s best frameworks pull together both macro and micro views. This balanced approach helps investors adjust to changing conditions without losing sight of fundamentals.
It also adds layers to risk assessment, integrating volatility, sector-specific challenges, and company-level details into a full risk profile.
When you’re managing long-term goals like a college fund or retirement, hybrid frameworks give you the confidence to pivot when the market shifts, without throwing your strategy out the window.
Many modern fundamental analysis methods also bring in:
- Environmental, social, and governance (ESG) metrics
- How emerging technologies might reshape business models
- Sustainability factors that influence long-term performance
Strong Analysis Leads to Smarter Investing
Fundamental analysis is the difference between chasing hype and building lasting wealth. By looking at a company from every angle—financial strength, leadership quality, industry context, and macroeconomic forces—you gain the clarity most investors miss. The real power comes from putting it all together. That’s how you avoid shaky bets, stay focused in volatile markets, and find real value others overlook.
Tired of juggling spreadsheets and digging for data? If you’re ready to stop guessing and start making data-backed decisions, understanding all the types of fundamental analysis is the place to begin. With Daloopa, your fundamental data updates are automated, so you can build and update financial models faster, without cutting corners. Spend less time chasing numbers and more time making smart moves. See how it works.


