
ROE shows how much profit a company squeezes out of its equity, while ROA tells us how efficiently it puts its entire asset base to work. These two metrics, when viewed together, help paint a clearer picture of whether strong returns come from sound operations or financial leverage. You’re about to learn how two simple percentages can protect your capital, spotlight hidden risks, and give you an actionable advantage by showing you why two companies posting identical net income might hide very different investment stories.
Key Takeaways
- When combined, ROE and ROA reveal whether profitability stems from sound operations or aggressive borrowing.
- A higher ROA signals more efficient use of assets and better day-to-day management.
- A large difference between ROE and ROA often reflects heavy debt usage.
Fundamentals of ROE and ROA
ROE and ROA are valuable indicators of a company’s ability to generate profit. One looks at how well equity is turned into income, while the other evaluates returns based on all assets. These ratios are crucial when analyzing financial ratios during any comprehensive financial statement analysis.
Definitions and Basic Calculations
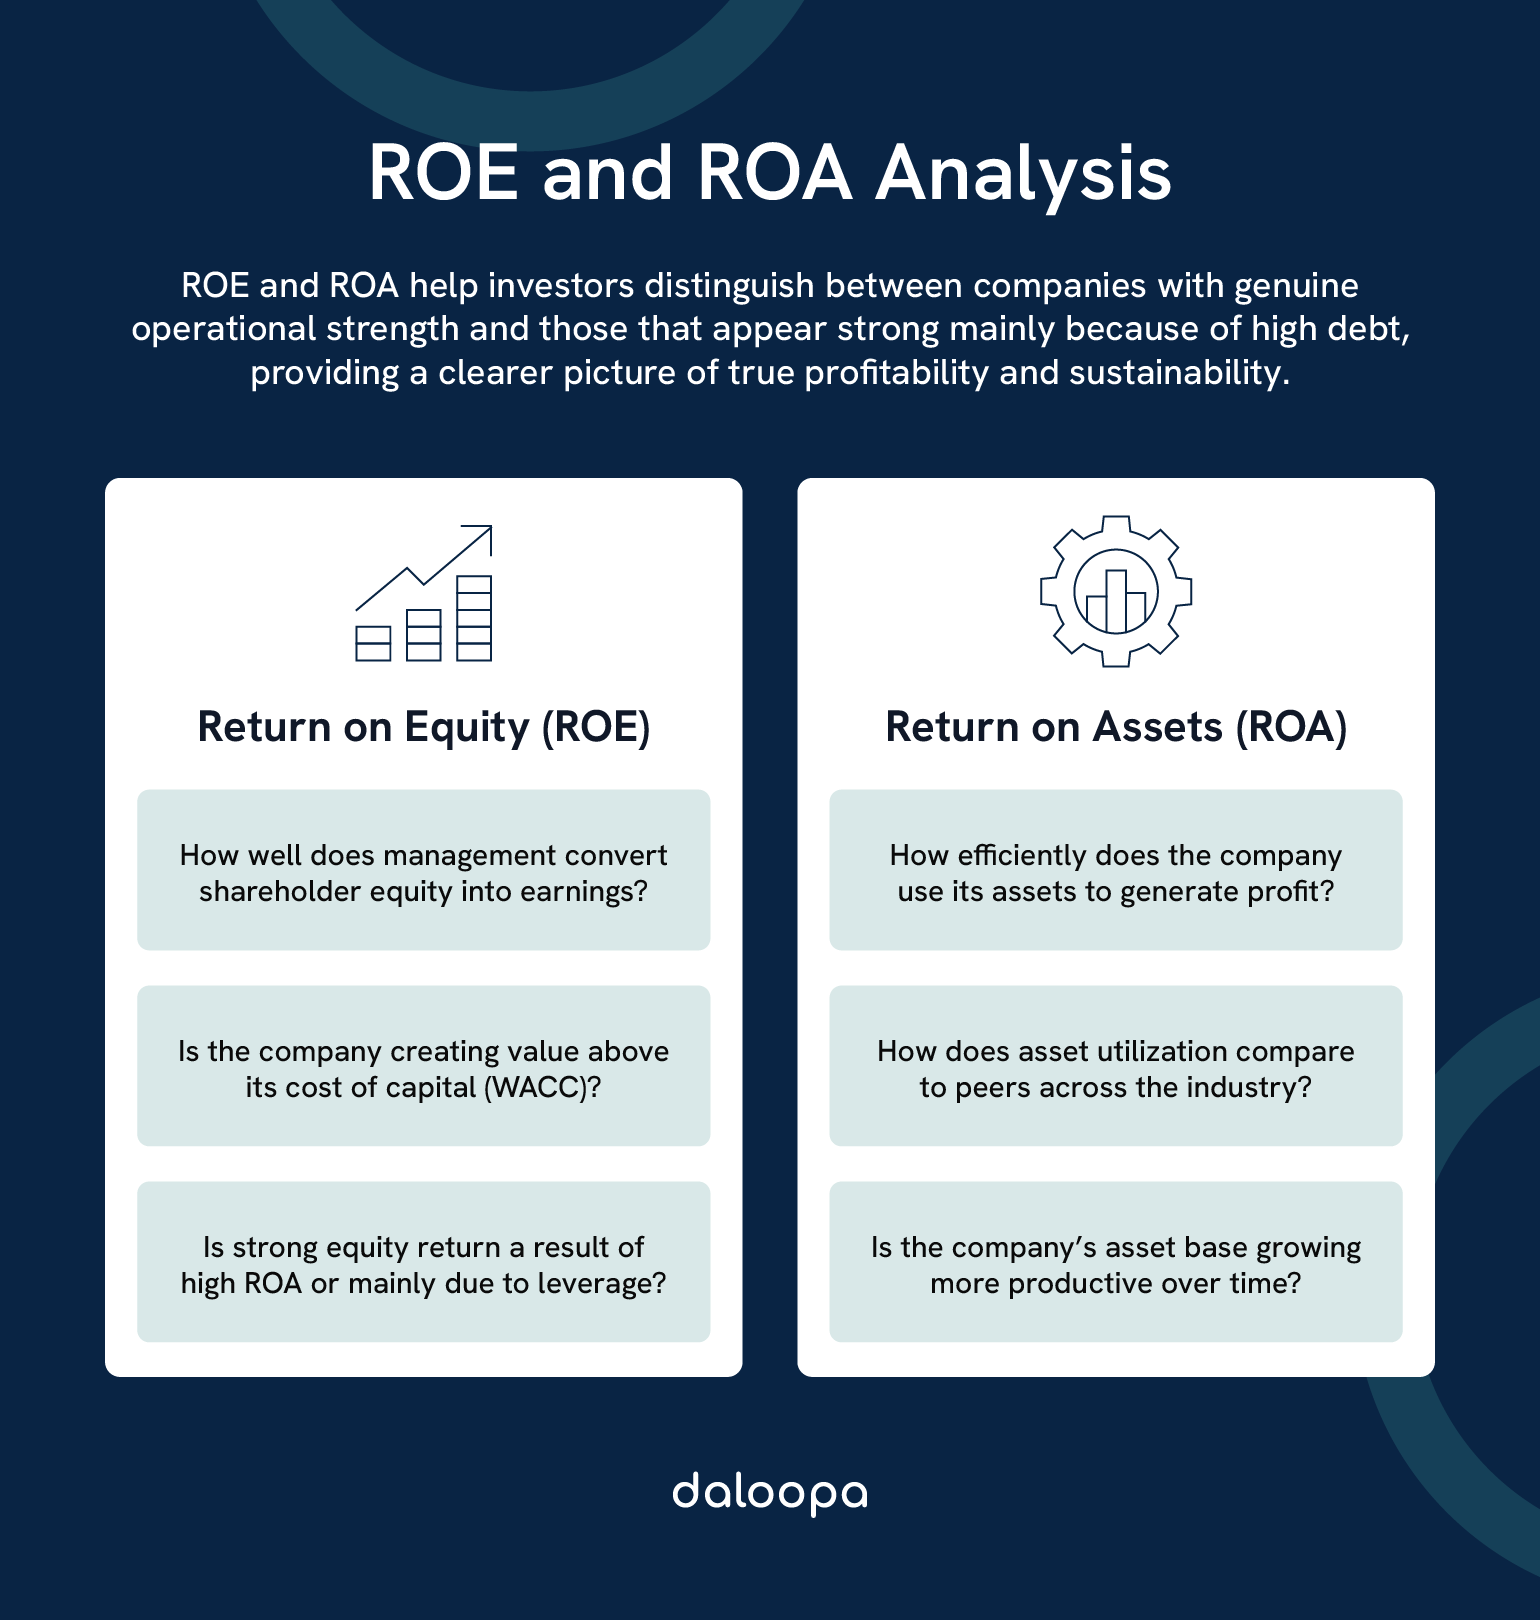
Return on Equity (ROE) measures how effectively a company converts shareholder funds into net income. You calculate it by dividing net income by shareholder equity and expressing the result as a percentage.
Return on Assets (ROA) looks at how productively all assets are used to earn income. To calculate it, divide net income by total assets.
Here’s a breakdown:
- ROE Formula: Net Income ÷ Shareholders’ Equity × 100
- ROA Formula: Net Income ÷ Total Assets × 100
Example: A company earns $3 million in net income, holds $20 million in total assets, and $10 million in equity:
- ROE = 30% ($3M ÷ $10M)
- ROA = 15% ($3M ÷ $20M)
By comparing those two percentages, you immediately know whether management is simply borrowing to boost equity returns or genuinely running the business efficiently. This is the essence of analyzing financial ratios for investment decisions.
Theoretical Framework and Significance
- ROE’s Purpose for You: As an investor or analyst, you care about ROE because it directly ties to the return on the capital you’ve invested or will invest. If ROE consistently exceeds what you could earn in alternative investments, you know management uses equity well.
- ROA’s Broader View: ROA strips out financing decisions—debt or equity—and focuses on how well the company’s entire asset base produces profit. When you compare two companies in different sectors, ROA is often more apples-to-apples because it doesn’t mask debt usage.
- Deciphering Gaps: A large spread between ROE and ROA signals leverage. Suppose a company posted 20% ROE and only 8% ROA in Q2 2022. That 12 percentage-point gap tells you that debt, not pure operational efficiency, has boosted returns.
When you combine ROE and ROA, you take the temperature of management’s capital-allocation decisions. If ROE far exceeds ROA, you ask: “Is this sustainable when debt costs rise or credit markets tighten?”
The DuPont Identity Connection
The DuPont Identity breaks ROE into three levers:
- Profit Margin (Net Income ÷ Revenue): Tells you how much profit you earn per dollar of sales.
- Asset Turnover (Revenue ÷ Total Assets): Measures how effectively assets generate revenue.
- Equity Multiplier (Total Assets ÷ Equity): Captures financial leverage; a higher multiplier means more debt relative to equity.
Here’s a hypothetical DuPont example:
- Net Income (TTM): $16.3 billion
- Revenue: $648.1 billion
- Assets: $252.4 billion
- Equity: $80.9 billion
Compute each lever:
- Profit Margin = 2.5% ($16.3B ÷ $648.1B)
- Asset Turnover = 2.57 ($648.1B ÷ $252.4B)
- Equity Multiplier = 3.12 ($252.4B ÷ $80.9B)
Thus,
- ROE = 2.5% × 2.57 × 3.12 = 20.0%
You see how each component contributes. If the company had instead financed more aggressively (bumping its equity multiplier to 4.0), its ROE would have jumped to 25.7%, but that wouldn’t reflect better operations—just higher leverage.
Comparative Analysis of ROE vs. ROA
ROE and ROA shine light on different parts of a company’s operations. They help you understand how debt, asset usage, and capital decisions affect overall performance. This comparative approach is critical when analyzing financial ratios in your broader financial statement analysis toolkit.
Capital Structure Insights
A company’s capital structure plays directly into how ROE and ROA compare. A wider gap between the two often signals heavier reliance on borrowed money.
Let’s say a retailer posts a 20% ROE with only 8% ROA—this likely points to significant debt in its financing mix.
You can calculate financial leverage by dividing total assets by equity. If that ratio climbs above 2.0, it suggests the company is leaning hard on debt.
Asset Utilization and Efficiency
ROA focuses purely on how effectively assets are turned into profits. It strips away financing decisions and drills into how well operations are run.
A firm generating $2 million in net income on $10 million in assets is clearly running more efficiently than a peer who needs $20 million in assets to reach the same result.
To deepen ROA analysis, consider complementary metrics like:
- Asset turnover
- How working capital is managed
- Productivity of fixed assets
ROA is especially useful for evaluating operational efficiency across companies in a standardized way, one of the core goals in financial statement analysis.
Industry-Specific Considerations
- Utilities: Expect low ROA (4–6%) because vast infrastructure anchors their asset base.
- Financials: Banks often show 12–15% ROE and 1–2% ROA.
- Tech/Software: Asset-light business models often deliver ROA north of 15–20%.
When you compare companies, adjust your expectations. A 6% ROA might be a red flag in SaaS but solid in utilities.
Analytical Applications and Interpretation
ROE and ROA aren’t just metrics—they’re filters for making smarter business and investment decisions. They help you weigh profitability, efficiency, and capital use in ways that charts alone can’t show. This is the power of analyzing financial ratios within your overall financial statement analysis.
Investment Evaluation Framework
- ROE vs. WACC: If ROE exceeds the firm’s Weighted Average Cost of Capital (WACC), management creates value. For example, suppose a company’s WACC is 10% and its ROE is 15%—you know it’s generating returns above what it costs to fund operations.
- ROIC vs. ROE: Return on Invested Capital (ROIC = Operating Income ÷ (Debt + Equity)) shows how well total capital (debt + equity) performs. If a company posts 12% ROIC but 18% ROE, you know leverage pushes equity returns beyond operational returns.
- Leverage Check: Always compute ROE – ROA. If that difference balloons (e.g., from 5 pp to 15 pp over a year), question whether debt pays off long term or just inflates short-term profit metrics.
Trend and Comparative Analysis
- Five-Year Trend Lines: Plot ROE and ROA over five years to see sustainability. A steady upward trend signifies consistent operational improvement, whereas a volatile pattern—say, 25% in 2020, 15% in 2021, 35% in 2022—hints at one-off events (acquisition gains, asset sales) rather than true business strength.
- Peer Comparisons: Compare a company’s ROE/ROA against sector medians. For example, if a tech firm shows 30% ROA but its peer median is 35%, investigate why it lags—maybe R&D spending is high relative to revenue, dragging down margins.
- Historical Context: If a company’s ROE historically averaged 12% (2018–2022) but jumped to 20% in 2023, check footnotes for one-time gains, like the sale of a subsidiary, instead of reading that spike as management prowess.
Benchmark sources:
- EIA (.gov): Utility ROA/ROE norms
- Damodaran Data: Industry WACC, ROA/ROE histograms
- Morningstar (.com): Sector-wide historical profitability ratios (premium subscription)
Limitations and Potential Misinterpretations
- Debt-Driven ROE: A high ROE might simply reflect high leverage.
- Accounting Policies: Depreciation methods (straight-line vs. accelerated) can skew ROA.
- One-Time Items: Adjust net income for sale of a major business unit to normalize ratios.
By adjusting for one-time events, consistent accounting policies, and debt levels, you ensure you compare apples to apples across companies and time.
Strategic Applications for Different Stakeholders
ROE and ROA serve more than just investors—they offer insights that help guide capital use, spot operational issues, and measure management effectiveness.
Investor Perspective
- Dividend-Oriented Investors: You look for ROE ≥ 15% with ROA ≥ 8% to ensure earnings aren’t simply debt-driven.
- Growth Investors: You target tech or biotech names where ROA often exceeds 20%.
- Value Investors: A stable ROA near industry average (say, 10% for industrials) with ROE near 15% signals prudent management.
Management Decision-Making
- Capital Allocation: When ROE and ROA diverge rapidly—e.g., from 10 pp gap to 15 pp gap—you know it’s time to revisit debt policy.
- Operational Reviews: When ROA underperforms peers, investigate asset turn and margin issues.
- M&A Decisions: Use DuPont to model how an acquisition changes ROE.
Advanced Analytical Techniques
- DuPont Time Series: Break ROE into annual profit margin, asset turnover, and leverage trends.
- EBITDA Margins + ROA: Since depreciation can distort ROA, you overlay EBITDA (excluding D&A) metrics. If EBITDA/Total Assets comes in at 15% compared to a 10% ROA, you know non-cash charges significantly affect EBIT.
- Sensitivity Analysis in Excel: Use Data Tables or Scenario Manager to see how a 1 pp change in profit margin (say, from 8% to 9%) affects ROE at various leverage levels.
Ready to Deepen Your Analysis?
Imagine slicing through data in seconds, accessing clean, AI-powered historical ratios, and benchmarking every company against industry norms—without manual data wrangling. With Daloopa AI, you’ll automate ratio calculations, integrate dynamic WACC inputs, and build rolling five-year trend dashboards that refresh as filings drop. Power smarter screening, backtest how profit-turn drivers evolve, and capitalize on the next market shift—before it’s on your competitor’s radar.
Experience the future of financial analysis: leverage Daloopa to elevate every investment decision.


