
We’ve seen young professionals and those transferring into the industry alike struggle to grasp the fundamental definitions of financial ratios in evaluating company performance. This guide aims to shed light on the most crucial ratios and how to use them effectively.
The Importance of Benchmarking
Before we dive into specific ratios, remember this golden rule: ratios are meaningless without context. Always compare your calculations against:
- Industry standards
- Company-specific targets
- Historical performance
- Competitor metrics
To gather this benchmark data, make use of:
- Industry reports
- Financial databases
- Competitor analysis
- Fundamental data Excel add-ins and AI analysis platforms.
Now, let’s explore the core ratios you’ll use in most analyses.
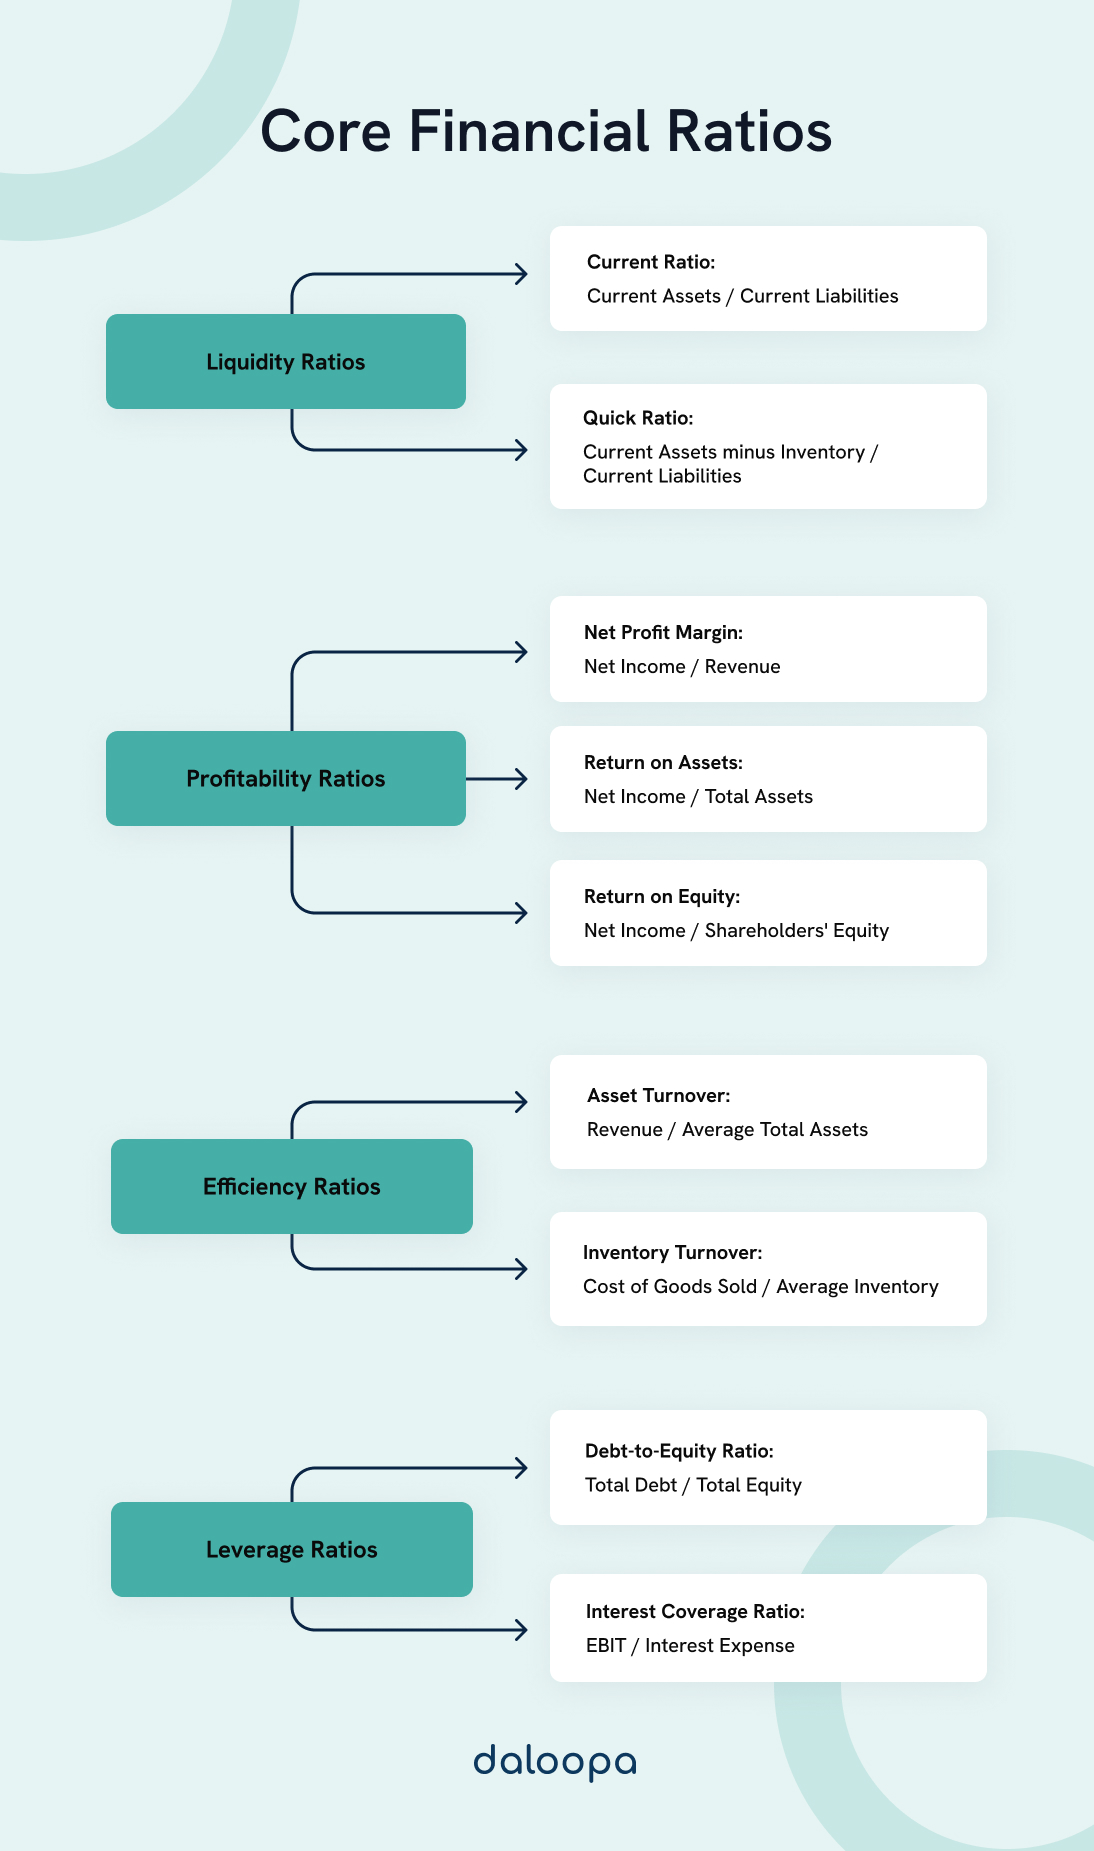
1. Liquidity Ratios: Assessing Short-Term Financial Health
Liquidity ratios help you understand a company’s ability to meet its short-term obligations.
Current Ratio
- Formula: Current Assets / Current Liabilities
- Interpretation: A ratio above 1 indicates the company can cover its short-term liabilities with its short-term assets.
Quick Ratio (Acid Test)
- Formula: (Current Assets – Inventory) / Current Liabilities
- Interpretation: Similar to the current ratio, but excludes inventory as it’s less liquid. A higher ratio indicates better short-term liquidity.
2. Profitability Ratios: Measuring Efficiency in Generating Profit
These ratios help you understand how effectively a company is generating profit relative to its resources.
Net Profit Margin
- Formula: Net Income / Revenue
- Interpretation: Shows the percentage of revenue that translates into profit. Higher is generally better, but compare within industries.
Return on Assets (ROA)
- Formula: Net Income / Total Assets
- Interpretation: Indicates how efficiently a company uses its assets to generate profit. Higher ROA suggests better asset utilization.
Return on Equity (ROE)
- Formula: Net Income / Shareholders’ Equity
- Interpretation: Measures profitability in relation to shareholders’ investment. Higher ROE often indicates better use of equity financing.
3. Efficiency Ratios: Evaluating Asset Utilization
These ratios help you understand how well a company is using its assets to generate revenue.
Inventory Turnover
- Formula: Cost of Goods Sold / Average Inventory
- Interpretation: Higher turnover usually indicates better inventory management. However, extremely high turnover might suggest stockouts.
Asset Turnover
- Formula: Revenue / Average Total Assets
- Interpretation: Higher turnover suggests more efficient use of assets in generating revenue.
4. Leverage Ratios: Assessing Financial Risk
These ratios help you understand the company’s capital structure and its ability to meet financial obligations.
Debt-to-Equity Ratio
- Formula: Total Debt / Total Equity
- Interpretation: Higher ratios indicate more leverage. This can amplify returns but also increases financial risk.
Interest Coverage Ratio
- Formula: EBIT / Interest Expense
- Interpretation: Measures how easily a company can pay interest on its debt. Higher ratios indicate better ability to cover interest payments.
6 Pro Tips for Young Analysts
- Always consider the industry context. What’s considered a good ratio in one industry might be poor in another.
- Look for trends. A single point-in-time ratio is less informative than a trend over several periods.
- Understand the limitations. Ratios are based on historical data and may not reflect future performance.
- Combine ratios for a fuller picture. No single ratio tells the whole story. Use a combination to get a comprehensive view.
- Be wary of manipulation. Some companies might try to manipulate their ratios. Always dig deeper if something seems off.
- Use ratios as a starting point, not an end point. They should guide your analysis, not replace critical thinking and deeper investigation.
Curious about speeding up financial analysis in Excel?
Remember, mastering these ratios takes time and practice. Keep refining your skills, stay curious, and always be ready to learn. The world of finance is ever-evolving, and so should your analytical toolkit.
Daloopa’s AI tech in Excel can enhance your current methods. Excel proficiency is crucial for assessing company performance, forecasting finances, or constructing valuation models, as it turns intricate data into comprehensible insights. It’s vital to first master the key formulas and ratios to work efficiently. Even with AI assistance, grappling with the basics can impede your analysis.


