
Financial statement analysis tools enable us to review and interpret financial data, uncovering valuable information for decision-making. These tools range from simple spreadsheets to sophisticated software applications. They help us examine the balance sheet, income statement, and cash flow statement – the three primary financial statements. By comparing these statements across different periods or companies, we can identify trends, strengths, and potential areas of concern.
Key Takeaways
- Financial statements comparison tools facilitate in-depth analysis of a company’s financial performance
- These tools help interpret data from balance sheets, income statements, and cash flow statements
- Effective use of comparison tools can reveal crucial insights for informed decision-making
Financial Statements Comparison Tools: An IB Analyst’s Perspective
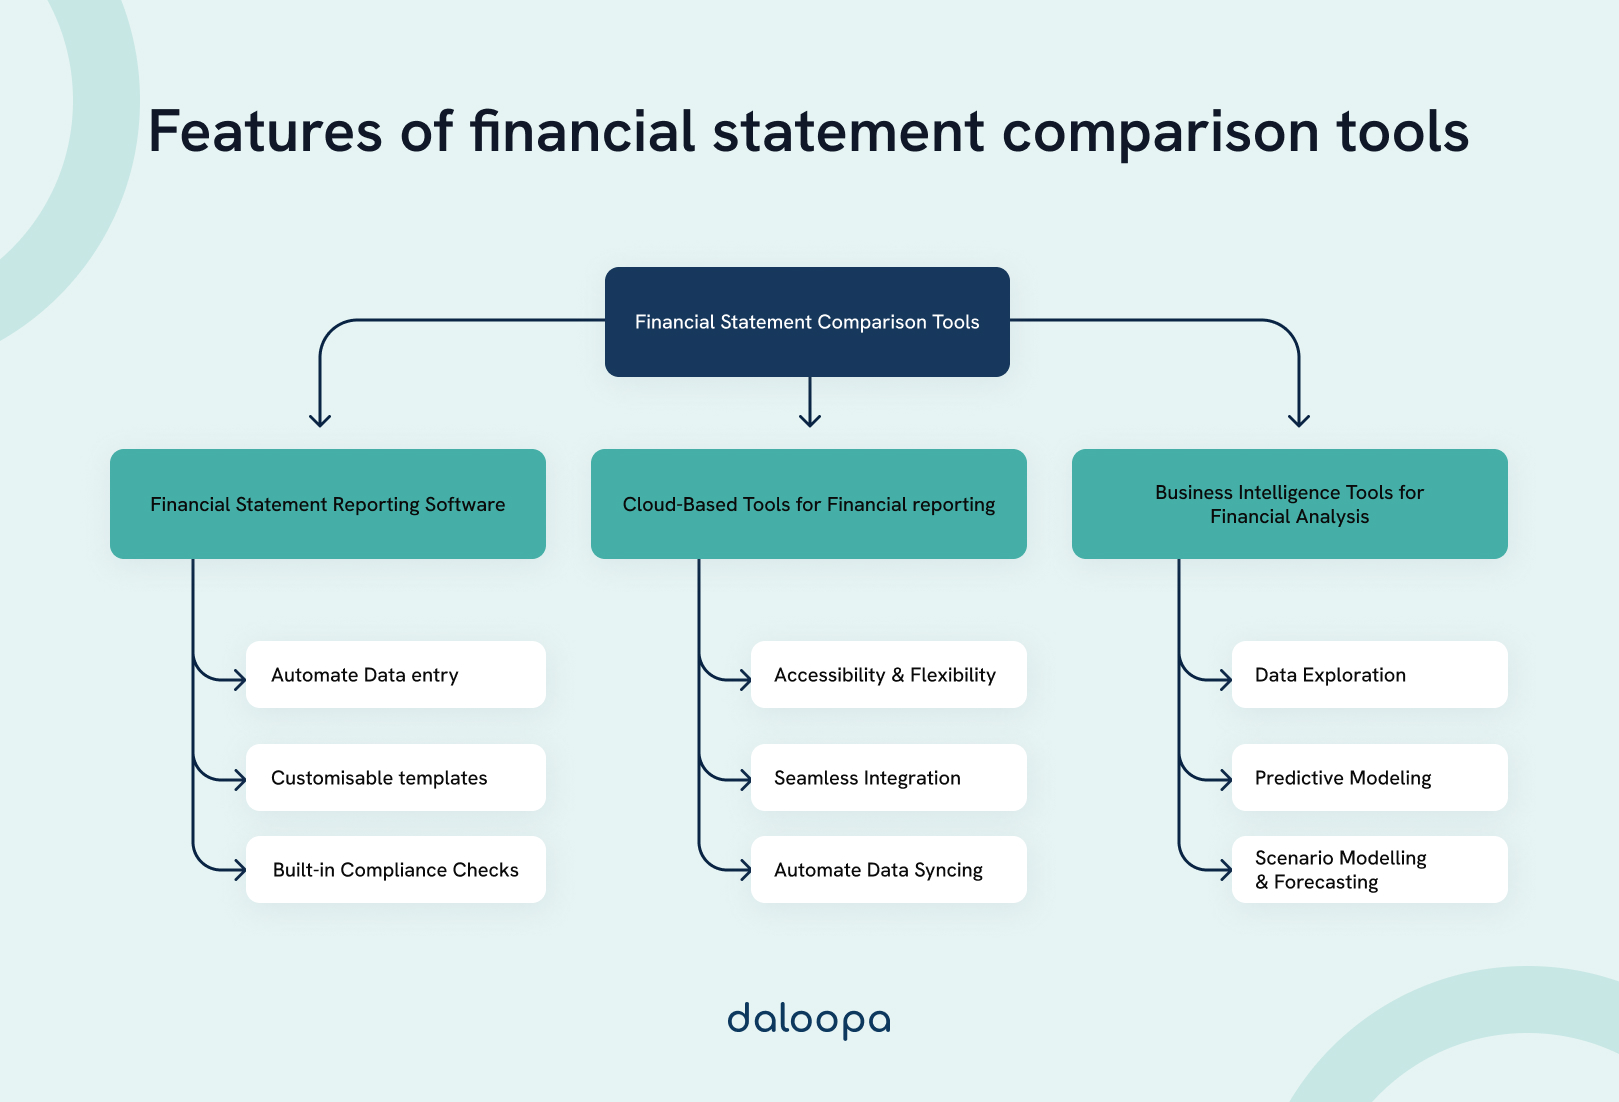
Investment banking analysts frequently rely on various tools to perform detailed financial statement analysis, comparisons, and reporting. These tools can be broadly categorized into three types: Financial Statement Reporting Software, Cloud-Based Tools for Financial Reporting, and Business Intelligence (BI) Tools for Financial Analysis.
Each of these tools offers distinct advantages and challenges, particularly in the context of the fast-paced and detail-oriented environment of investment banking.
1. Financial Statement Reporting Software
Financial Statement Reporting Software is typically desktop-based or locally hosted, focusing on the preparation, comparison, and detailed reporting of financial statements. These tools are often part of comprehensive accounting software suites. They are indispensable for generating standardized financial reports, crucial for transaction analysis, due diligence, and financial modeling.
Pros
- Customization: Allows for tailored reporting aligned with specific deal requirements, industry standards, or client preferences, providing flexibility in presenting data.
- Integration: Seamlessly connects with internal financial systems, ensuring accuracy and efficiency when aggregating data for analysis.
- Data Security: Locally hosted software enhances control over sensitive financial data, critical for maintaining confidentiality in deal-related activities.
Cons
- Cost: Significant upfront investment is required, including software licensing, implementation, and ongoing maintenance—factors to consider when evaluating ROI.
- Scalability: May struggle to scale with increasing deal volume or complexity, potentially requiring additional hardware or software investments.
- Limited Accessibility: The lack of remote accessibility can be a bottleneck, particularly during extended deal cycles that demand constant monitoring and updating of financial models.
2. Cloud-Based Tools for Financial Reporting
Cloud-Based Tools for Financial Reporting provide online platforms that allow analysts to prepare, compare, and analyze financial statements from virtually anywhere. These tools offer real-time collaboration features, which are crucial during high-pressure situations like deal closings or when working across global teams.
Pros
- Accessibility: Enables round-the-clock access, which is essential for the often unpredictable hours and remote collaborations typical in investment banking.
- Scalability: Easily adjusts to the demands of large-scale transactions, whether it is integrating additional datasets or managing multiple deals simultaneously.
- Automatic Updates: The provider manages updates and compliance changes, ensuring the tools are always equipped with the latest features and regulations—critical for staying competitive.
Cons
- Data Security: Storing sensitive financial data in the cloud poses potential risks, especially concerning client confidentiality and regulatory compliance.
- Dependence on Internet: Relies on a stable internet connection, which could be a limitation when traveling or working in areas with unreliable connectivity.
- Subscription Costs: The ongoing subscription fees can accumulate, especially when using multiple tools across several transactions, impacting overall cost management.
3. Business Intelligence (BI) Tools for Financial Analysis
BI Tools for Financial Analysis are advanced platforms designed to process and analyze large datasets, offering deep insights through data visualization, trend analysis, and predictive modeling. These tools go beyond basic financial statements comparison, providing IB analysts with the analytical firepower needed to uncover strategic insights, identify deal synergies, and support decision-making.
Pros
- Advanced Analytics: Provides robust analytical capabilities essential for identifying trends, forecasting financial outcomes, and supporting complex valuation models—key for M&A, IPOs, and other high-stakes transactions.
- Data Visualization: Offers powerful visualization tools that help communicate complex financial data effectively to senior bankers, clients, and stakeholders.
- Integration: Can pull in data from multiple sources, enabling comprehensive analysis that includes market data, competitor financials, and macroeconomic indicators—needed for thorough due diligence and strategic advisory.
Cons
- Complexity: The sophisticated nature of BI tools often requires advanced training or specialized knowledge, potentially leading to a steep learning curve for junior analysts.
- Cost: BI tools are generally more expensive, with significant costs associated with licensing, training, and potential customization. This expense must be weighed against the value they add in terms of deal insights.
Overkill for Routine Tasks: For routine financial analysis or smaller deals, the extensive features of BI tools might be excessive, leading to underutilization and potentially diverting resources from more critical tasks.
Choosing the Right Financial Statements Comparison Tool
Key financial statements comparison tools offer powerful capabilities for analyzing and understanding financial data. These tools provide essential features that enable businesses to make informed decisions and gain valuable insights.
Real-Time Financial Reporting Capability
Real-time financial reporting allows businesses to access up-to-the-minute financial data. This feature enables quick decision-making based on current information. We find that real-time reporting reduces delays in financial analysis and helps identify trends as they emerge. It also supports proactive financial management by alerting users to potential issues before they escalate.
Many tools offer customizable dashboards that display key metrics in real-time. These dashboards can include:
- Cash flow status
- Revenue trends
- Expense breakdowns
- Profit margins
Real-time reporting also facilitates better collaboration among team members, as everyone can access the same current data.
User-Friendly Interface for Easy Navigation
A user-friendly interface is crucial for efficient financial analysis. Well-designed tools offer intuitive navigation, clear data visualization, and easy-to-use features.
Key aspects of a user-friendly interface include:
- Drag-and-drop functionality
- Customizable reports and charts
- Search and filter options
- Context-sensitive help
We find that user-friendly interfaces reduce the learning curve for new users and increase productivity for experienced analysts. They also make it easier to share financial insights with non-financial stakeholders.
Many tools now offer mobile compatibility, allowing users to access financial data on smartphones and tablets. This feature enhances flexibility and supports remote work scenarios.
What Data Is Most Commonly Compared?
Financial statements provide crucial insights into a company’s financial health and performance. Three statements form the foundation for comprehensive financial analysis and comparison.
Income Statement
The income statement, also known as the profit and loss statement, reveals a company’s revenues, expenses, and profitability over a specific period. It starts with total sales and deducts various costs to arrive at net income.
Key components include:
- Revenue
- Cost of goods sold
- Gross profit
- Operating expenses
- Net income
We analyze the income statement to assess a company’s ability to generate profit from its core business activities. It helps identify trends in revenue growth, cost management, and overall profitability.
Comparative analysis of income statements across multiple periods or companies can reveal important trends and competitive advantages.
Balance Sheet
The balance sheet provides a snapshot of a company’s financial position at a specific point in time. It lists assets, liabilities, and shareholders’ equity, adhering to the fundamental accounting equation: Assets = Liabilities + Shareholders’ Equity.
Key sections include:
- Assets (current and non-current)
- Liabilities (current and non-current)
- Shareholders’ equity
We use the balance sheet to assess a company’s liquidity, solvency, and overall financial strength. It helps evaluate the company’s ability to meet short-term obligations and long-term financial stability.
Comparing balance sheets over time or between companies can reveal changes in financial structure and resource allocation strategies.
Cash Flow Statement
The cash flow statement tracks the movement of cash in and out of a business over a specific period. It provides insights into a company’s ability to generate cash and meet its financial obligations.
The statement is divided into three sections:
- Operating activities
- Investing activities
- Financing activities
We analyze cash flow to assess a company’s liquidity, financial flexibility, and ability to fund growth. It helps identify potential cash flow problems and evaluate the quality of earnings reported in the income statement.
Comparing cash flow statements across periods or companies can reveal differences in cash management strategies and operational efficiency.
4 Ways Financial Statements Data Is Used Inside of Companies
Comparing financial statements is a critical task for financial analysis, benchmarking, and strategic decision-making. But it is equally important to understand how our counterparts internally aggregate and digest this same information. Several types of software can help you with this, ranging from accounting software with built-in reporting features to specialized financial analysis and comparison tools.
Note: While there is an overlap of features offered by each of these software types, none is a universal solution. Many companies use two or more types together in order to fulfill their specific needs.
1. Accounting Software
Accounting software often comes with basic financial statements comparison features and is suitable for small- to medium-sized businesses.
Pros
- Direct access to financial data
- Built-in reporting features
- Typically user-friendly for accountants
Cons
- Generally lack advanced analytical features
- Limited customization options
- Often focused on single-company analysis
2. Financial Planning & Analysis (FP&A) Software
FP&A software is designed for more detailed financial planning, budgeting, forecasting, and analysis, including comparing financial statements.
Pros
- Designed specifically for financial analysis
- Robust forecasting and modeling capabilities
- Great for multi-company comparisons
Cons
- Can be expensive
- May require specialized training
- Data input can be time-consuming if not integrated with accounting systems
3. Business Intelligence (BI) Tools
BI tools are powerful for data visualization and advanced analysis, enabling detailed comparisons and insights. Most are designed to analyze more than just financial data, like customer data, marketing information, and operations analysis.
Pros
- Powerful data visualization capabilities
- Handle large datasets easily
- Often cloud-based, allowing for real-time collaboration between multiple users
Cons
- Can require technical skills to set up and use effectively
- Potentially high cost for full-featured versions
- Can be overkill for simple financial comparisons
4. Spreadsheet Software
Spreadsheets like Microsoft Excel and Google Sheets are highly versatile and commonly used for financial statements comparison. They generally require a lot of manual labor to incorporate datasets and set up analysis reporting, which makes them particularly prone to human error.
Pros
- Low cost
- Most people can pick up and start using spreadsheets relatively easily
- Highly flexible and customizable
Cons
- Prone to human error
- Can become unwieldy with large datasets
- Typically don’t come with real-time data integration out of the box
Enhancing Analysis With AI and Evolving Visualization Techniques
Financial statements comparison tools are essential for effective financial analysis and decision-making. We have explored various techniques that allow us to extract valuable insights from financial data. These tools enable us to identify trends, assess performance, and make informed business choices. By comparing financial statements across periods or companies, we gain a deeper understanding of financial health and competitiveness.
Unlock the power of comprehensive financial data and streamlined analysis with Daloopa. Our platform offers the deepest and most accurate set of historical data for over 5,000+ public companies, helping you make informed decisions with confidence. Experience real-time updates, one-click model maintenance, and audit-ready data right within your existing workflows. Create a free account and take the first step towards superior financial insights.


