
Ever wonder how a profitable business still runs out of money?
Relying on net income alone can be dangerously misleading. While it may show profitability on paper, it includes non-cash adjustments and accounting rules that don’t always line up with how much money is actually available to spend. Free Cash Flow (FCF), on the other hand, shows the true liquidity. That is, how much cash a business has left after covering its core operations and reinvestment needs. A company can look profitable on paper while running low on real cash, or vice versa. That disconnect has serious implications for how a business manages debt, growth, and day-to-day operations. This is why a clear financial metrics comparison between FCF and Net Income is essential.
Key Takeaways
- FCF reflects real cash that can be used by the business; Net income includes accounting-based items that may not involve cash movement.
- Profit on paper doesn’t always mean enough cash to handle expenses or invest in growth.
- Tracking FCF routinely helps flag cash-related risks before they disrupt operations.
Fundamentals Of Financial Measurement
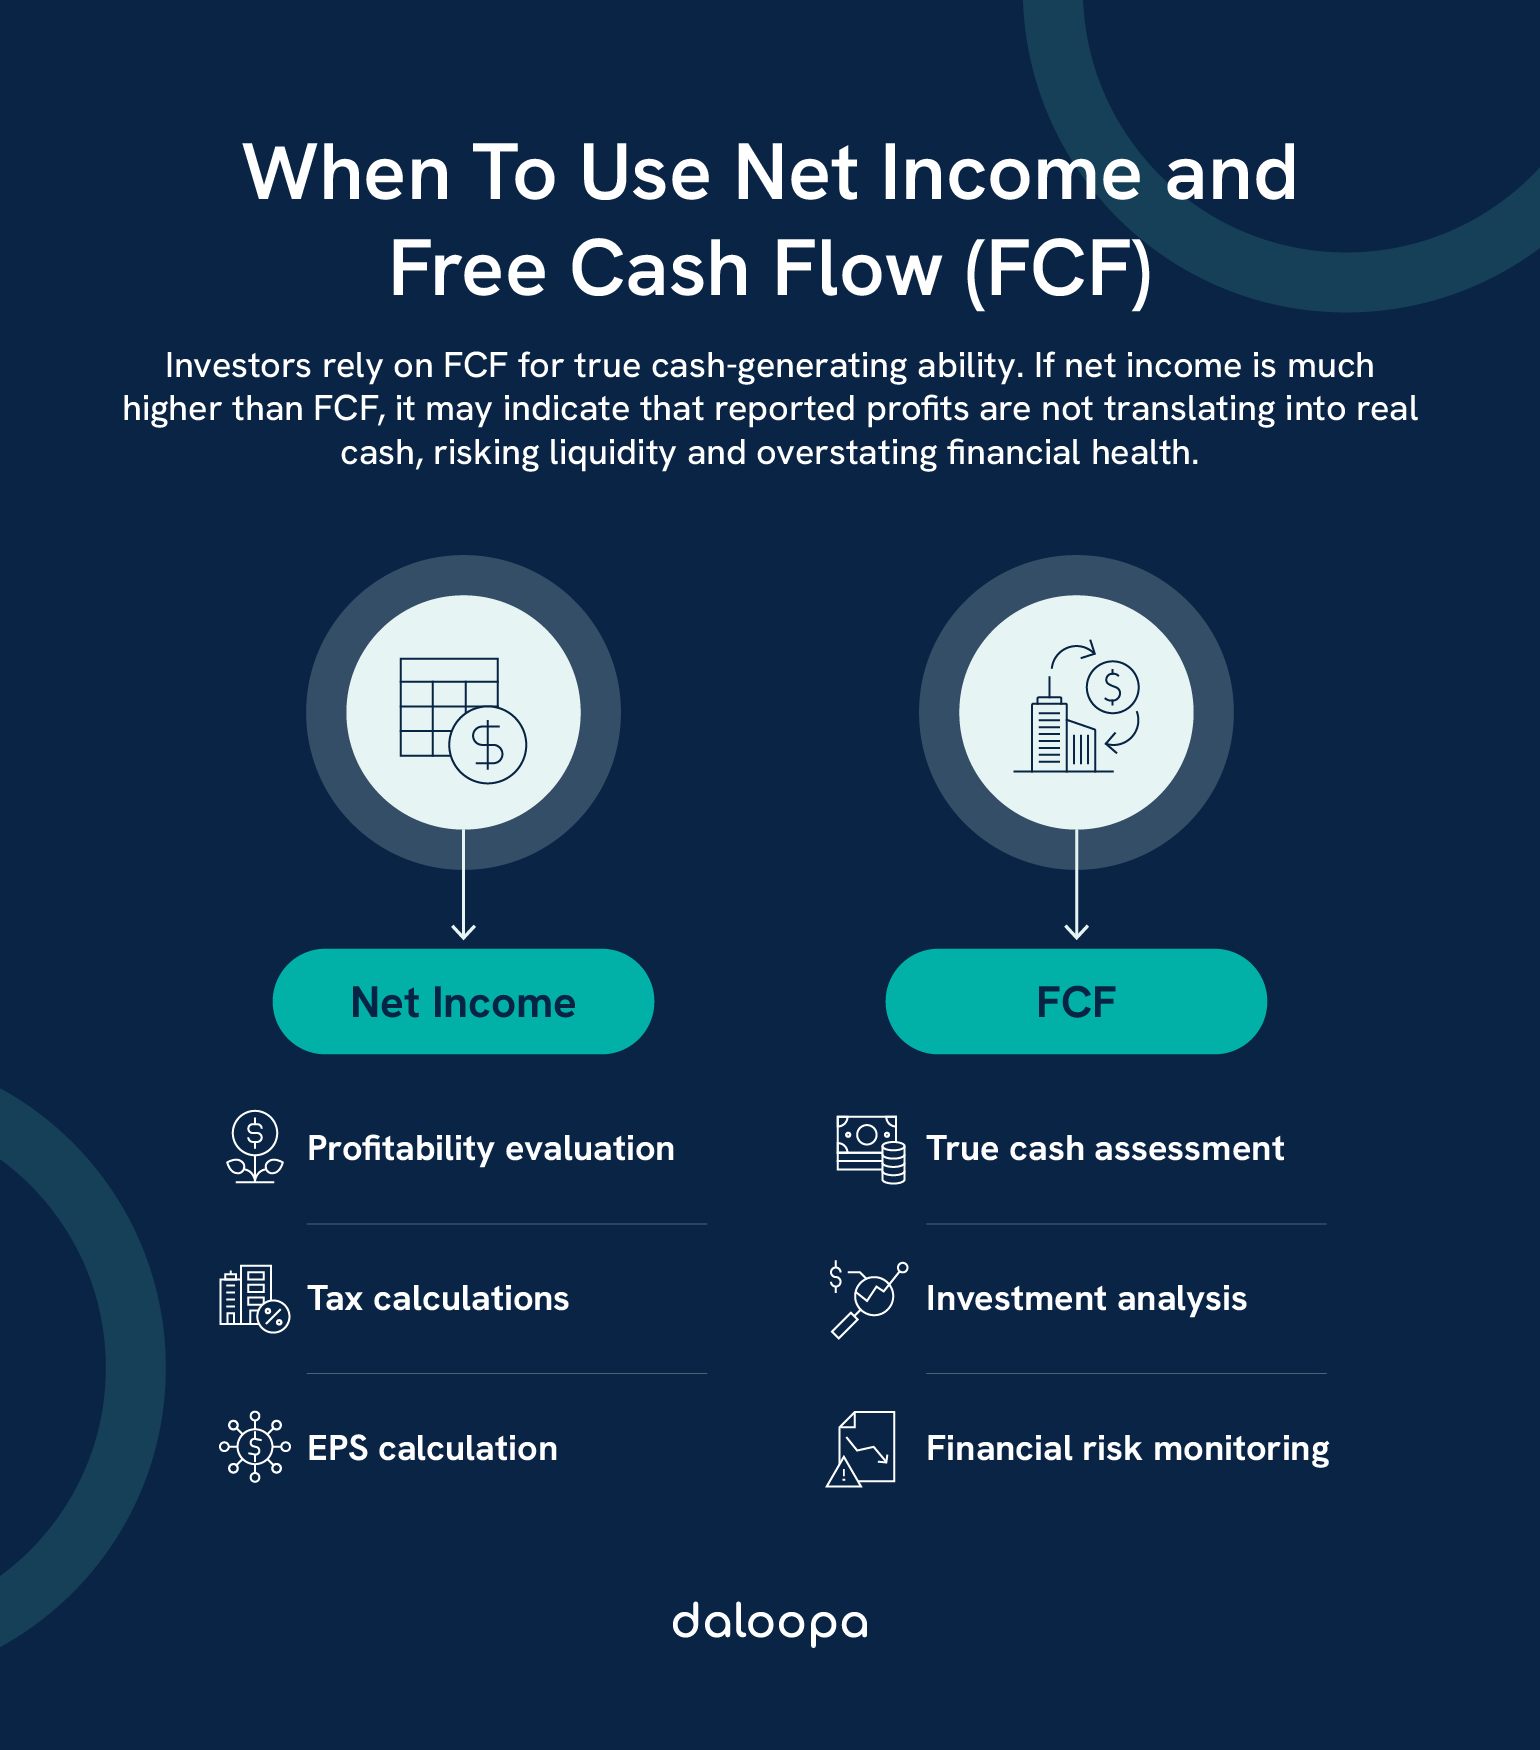
To evaluate a company’s financial position, it’s important to understand the difference between net income and free cash flow. The two metrics come from different financial statements, income versus cash flow, and follow different rules. Conducting a proper financial metrics comparison requires understanding both.
Net Income Explained
Net income is the profit shown on the income statement after subtracting expenses from revenue. It follows accounting rules and includes both real and theoretical costs.
For instance, depreciation and amortization reduce net income without affecting cash. That can make profit look smaller than the actual money coming in.
This metric is governed by accrual accounting. That means revenue is counted when earned and expenses when incurred, even if no cash changes hands. So, making a sale on credit increases profit immediately, despite the cash arriving later.
Free Cash Flow (FCF) Defined
FCF focuses on the actual cash that remains after running the business and paying for equipment or assets. It shows what’s truly available to pay down debt, reinvest, or reward shareholders.
FCF follows cash accounting principles, measuring what’s actually been paid or received. The formula starts with operating cash flow, then subtracts capital expenditures. That Free Cash Flow calculation highlights how much money is physically moving in and out, not what’s on paper.
That’s why some companies show a profit while still facing cash shortfalls—there’s often a timing lag between recording revenue and collecting payment. Comparing FCF and Net Income through cash flow ratios tools can expose these differences.
FCF is directly affected by working capital changes. For example, buying more inventory or letting customers delay payments uses up cash, while negotiating later payments to suppliers keeps more cash on hand.
Practical FCF and Net Income Applications And Decision-Making
Net income and FCF both offer insights that guide how companies operate, grow, and allocate resources. The main difference? Net income reflects accounting-based profitability, while FCF shows real-time liquidity and operational strength.
Business Health Assessment
FCF gives a clearer view of financial flexibility. A firm might look profitable on paper but still fall short when it comes to paying suppliers or covering payroll. This is why performing an ongoing financial metrics comparison is vital.
Think of a mid-sized retail chain. On paper, they may be turning a profit. But if suppliers aren’t getting paid on time, or there’s not enough cash to keep inventory stocked, trouble is brewing.
Net income might miss this red flag because it does not track timing or liquidity. Consistently strong FCF points to healthy, efficient operations. It suggests the business can keep growing without borrowing or issuing more shares.
These three cash flow ratios help assess financial health:
- FCF/Net Income Ratio: Over 1.0 shows strong cash support for reported profits
- FCF/Total Assets: Indicates how efficiently assets generate cash
- FCF/Sales: Measures how well revenue translates into usable funds
These metrics are cash reality checks. If they are weak, you risk layoffs, missed payments, or stalled growth despite looking profitable.
On the flip side, a temporary dip in FCF, say, due to major investment, doesn’t necessarily mean the business is unhealthy. Net income can help contextualize that.
Investment Analysis
Investors use FCF to judge a company’s long-term value. Forecasting future cash flows helps determine how much a business is really worth, not just how profitable it looks. FCF actually falls under Warren Buffett’s key investment tenets, aligning with his value investing principles.
A manufacturing firm could show solid earnings, but if it’s burning through cash, investors will think twice before jumping in.
Popular investor metrics using FCF include:
- Free Cash Flow Yield
- Price-to-Free Cash Flow Ratio
- FCF Return on Investment
A growing FCF trend may point to a strong, well-run business. It’s also helpful to compare how FCF growth stacks up against revenue growth to identify sustainable expansion. This is what helps investors avoid betting on “profitable” companies that can’t pay their bills.
That said, consistent net income performance over time still signals solid margins and operating efficiency, sometimes even when FCF is volatile.
Capital Allocation Decisions
For business leaders, FCF helps determine where to direct available funds. With enough cash, they can:
- Buy new equipment
- Pay off loans
- Distribute dividends
- Repurchase stock
- Expand the business
FCF patterns also guide timing. When FCF is strong, companies can confidently move forward with new initiatives without plunging the business into debt.
Net income can also indicate whether operations are trending profitably. This can be useful when planning future investments or seeking financing.
In simple terms, FCF shows what is in your wallet. Net income shows what you are building toward.
Small Business Applications
For smaller companies, monitoring both net income and FCF is critical. FCF, in particular, gives early warnings about potential cash crunches. According to the U.S. Chamber of Commerce, cash flow is one of the top reasons why small businesses fail.
Weekly cash flow projections can guide:
- Inventory restocking
- Staff planning
- Maintenance work
- Promotional efforts
Think of a neighborhood bakery during a slow month. It might “make a profit” thanks to pre-booked event orders, but without enough FCF, it can’t even afford flour for next week.
Net income can still offer important clues, like rising costs or shrinking margins, that could lead to future cash issues if left unaddressed. But businesses with seasonal cycles can use FCF to budget smarter during slow periods and prepare for demand spikes.
Common Pitfalls And Limitations
FCF isn’t immune to quirks. It can be skewed by:
- Unusual or infrequent capital expenses
- Shifts in working capital
- Changes in accounting methods
- Non-regular payment schedules
Meanwhile, net income still matters for taxes and external reporting. That’s why it’s wise to consider both numbers in tandem to avoid costly blind spots. Relying on either number in isolation risks making decisions that leave you cash-strapped or blindsided by tax bills.
Using A Balanced Approach
Smart financial management means tracking both FCF and net income consistently. Useful practices include:
- Monthly FCF tracking
- Comparing quarterly performance
- Watching year-over-year trends
- Studying the cash conversion cycle
Setting target levels for FCF can also flag potential trouble early. A combined view of both metrics supports sharper decision-making and steadier operations. It helps you steer clear of false confidence and stay ahead of cash trouble before it snowballs into crisis.
Net Income and FCF: Financial Clarity Through Cash and Profit Metrics
Net income may show a business is profitable, but it doesn’t guarantee there’s money in the bank. It follows accounting rules, includes non-cash items like depreciation, and records sales before the cash even arrives.
Free Cash Flow (FCF), on the other hand, tracks the actual cash left after running the business and making necessary investments. It’s what is available to pay debts, fund growth, or build a cushion for slow months. FCF gives a real-world snapshot of financial health, that is, what a company can actually do with its profits.
Still, net income is not irrelevant. It highlights profitability trends, tax obligations, and cost issues that FCF alone might miss. Used together, these two metrics provide a clearer, more balanced view of performance and sustainability. This balanced financial metrics comparison is the key to smart decision-making.
Want a clearer picture of how your investments are doing? Daloopa delivers clean, reliable financial data that makes tracking metrics simple and fast. See how Daloopa can help make your investment process more efficient.


