
Feeling lost in the market’s unpredictable chaos? Investing based on hunches or what everyone else does often leaves you anxious, second-guessing every decision. The importance of fundamental analysis transforms how you invest, helping you build a portfolio you truly understand. It offers a structured way to evaluate companies based on their actual operations, numbers, and leadership.
By studying financial statements, economic trends, industry dynamics, and leadership track records, investors can make informed decisions with clarity and confidence. It shifts your attention away from market noise and toward the real business engine driving results.
Knowing why you’ve chosen a particular stock, backed by a thorough review of its health and outlook, is what separates confident investors from guessers. Whether it’s a steady dividend payer or a high-growth disruptor, fundamental analysis gives you the logic to back your picks and highlights its importance for every long-term investor.
Key Takeaways
- Fundamental analysis focuses on business performance to determine a company’s actual value.
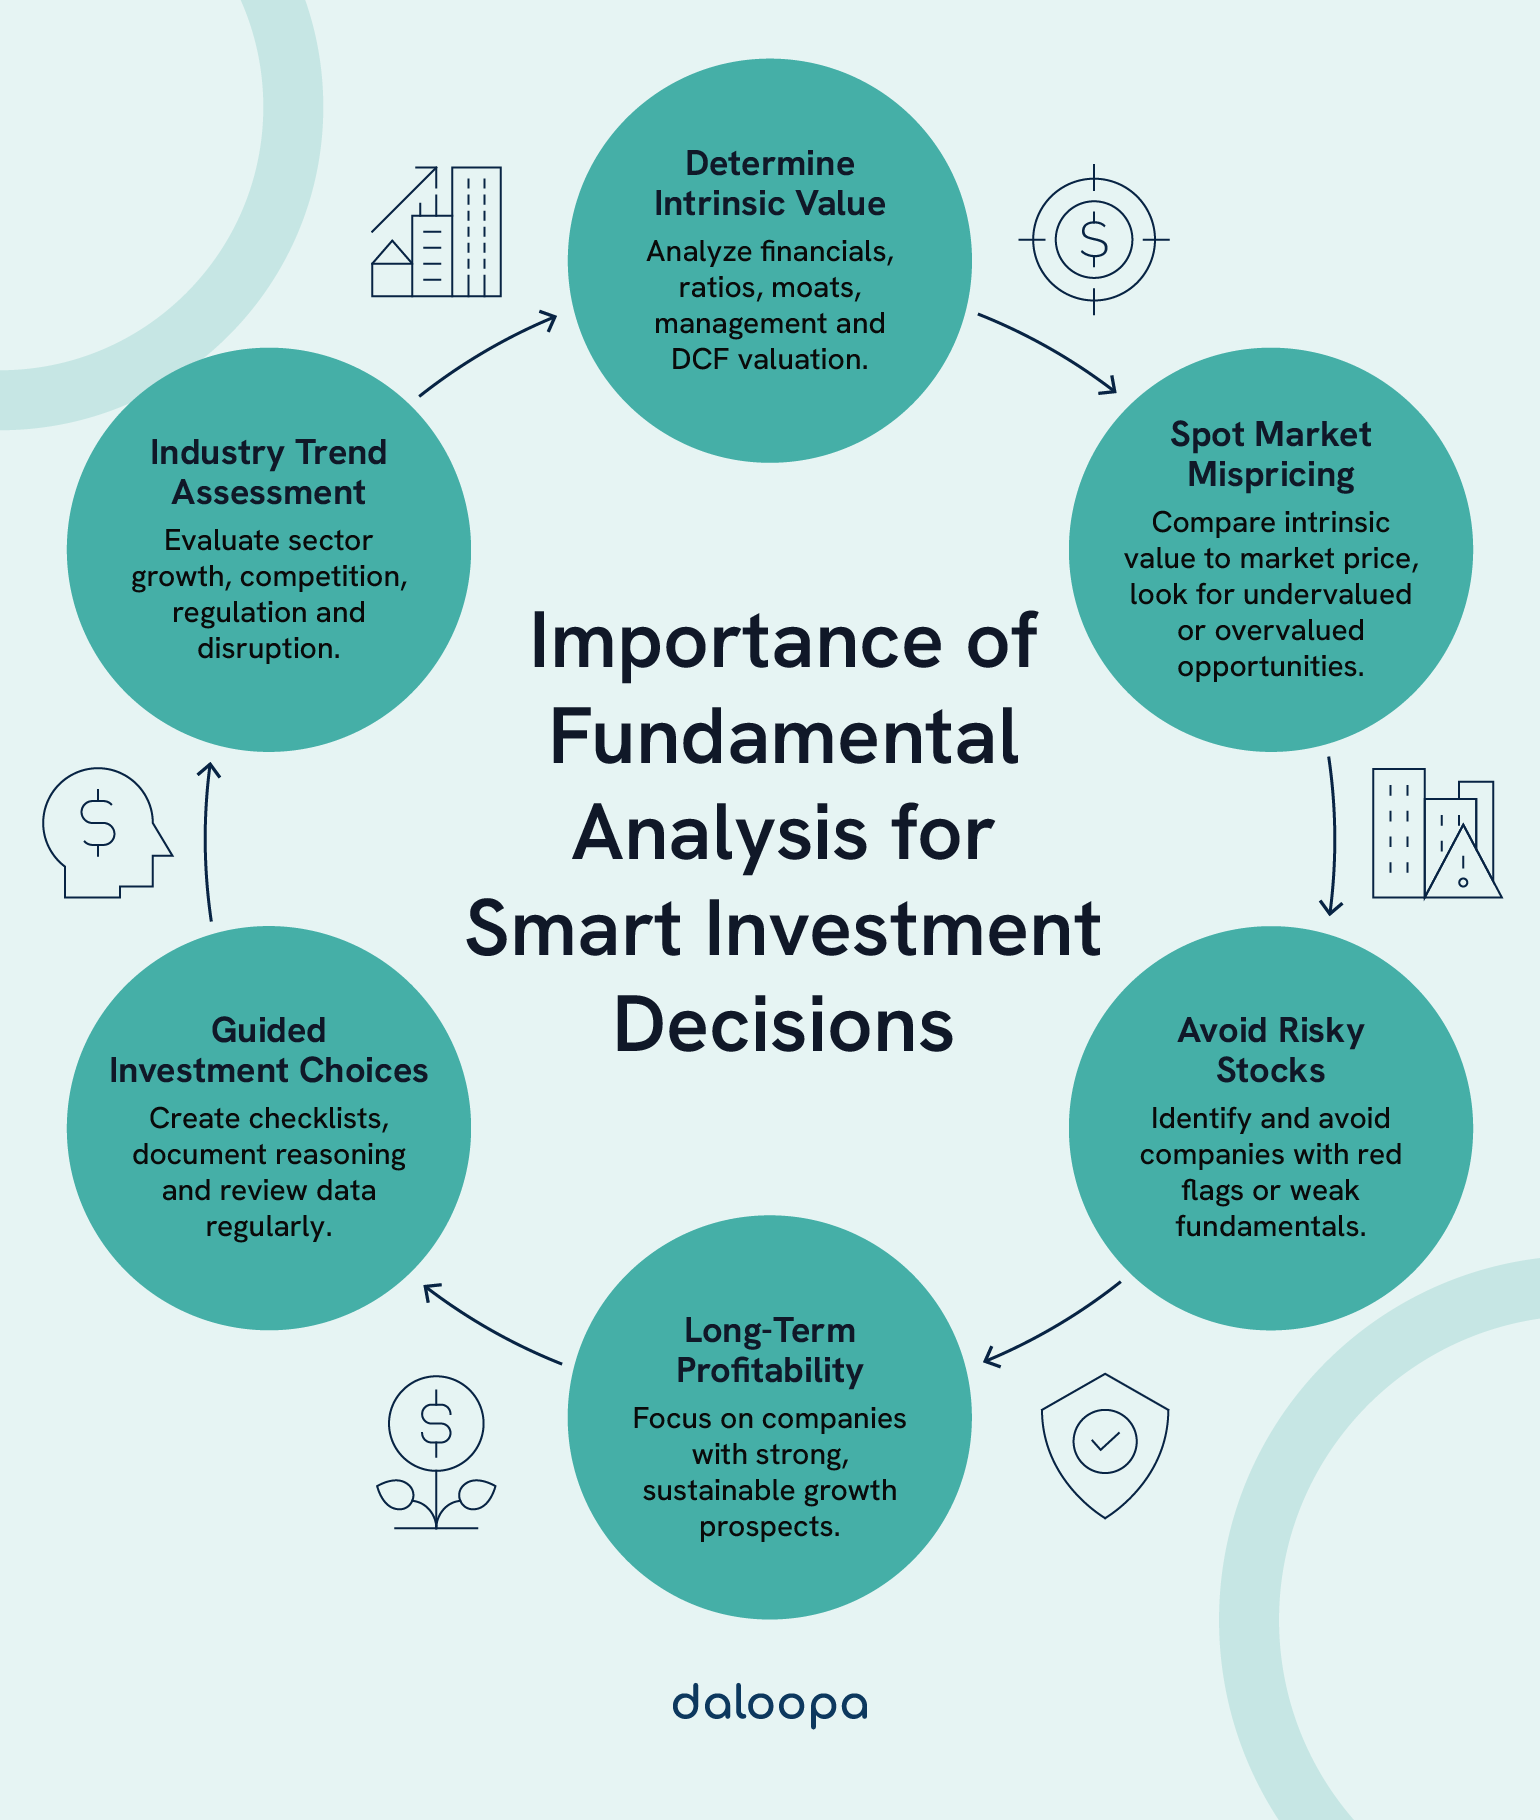
- The process involves clear steps, from valuing a company and spotting mispricing to avoiding weak stocks and assessing industry trends.
- The importance of fundamental analysis lies in building confidence by teaching investors to understand what they own and why.
Definition And Core Principles
Fundamental analysis is the anchor point for investors looking to build long-term conviction. It’s a discipline rooted in measuring real-world business performance and comparing it to what the market is pricing in. The importance of fundamental analysis cannot be overstated—it’s what allows investors to go beyond hype and anchor their decisions in reality.
Explanation Of Fundamental Analysis As A Method To Evaluate A Company’s Intrinsic Value
Fundamental analysis offers a detailed framework to estimate what a company is truly worth by reviewing how well its business performs and what advantages it holds in its market.
There are three core areas we analyze:
- Financial performance (income, cash flow, balance sheet)
- Industry environment (market share, competition, regulations)
- Macroeconomic signals (interest rates, demographics, inflation)
With this data for fundamental analysis, we determine the company’s intrinsic value, that is, what it should be worth if you were buying the whole business. A price below that value points to a potential opportunity.
Distinction Between Fundamental Analysis And Technical Analysis
Fundamental analysis and technical analysis approach investing from different angles. Fundamental analysis looks inward—at business realities. Technical analysis looks outward—at trading patterns.
While technical analysis leans on chart signals to predict short-term moves, fundamental analysis asks: “Is this a good business at a fair price?” For investors focused on long-term results, the fundamentals tend to offer deeper insight. Combining fundamental analysis and technical analysis can sometimes enhance decision-making, but for most long-term investors, the importance of fundamental analysis remains foundational.
So, rather than following price momentum or chart formations, fundamental analysis centers around whether the company’s operations and value justify its current price.
Historical Development And Theoretical Foundations
In 1934, Benjamin Graham and David Dodd laid the foundation of modern fundamental analysis in their book Security Analysis. They taught that real investing begins with knowing what a company is worth.
In the 1970s, some challenged this with the efficient market hypothesis, which claimed that prices already reflect all known info. But Warren Buffett, Graham’s student, showed otherwise. His consistent outperformance demonstrated that good businesses at fair prices can still beat the market.
Their ideas remain the backbone of value-focused investing today.
Key Principles That Underpin Effective Fundamental Analysis
Some of the most important tools for evaluating companies include:
- Price-to-earnings (P/E) to judge market expectations (e.g., how many dollars investors are willing to pay for one dollar of a company’s earnings)
- Return on equity (ROE) to measure efficiency (e.g., how effectively a company turns shareholder money into profit)
- Debt-to-equity to assess risk (e.g., how much debt a company uses to finance its operations compared to its own assets)
- Free cash flow as a sign of financial health (e.g., how much cash a company has left after covering its expenses; what’s truly “left over” to reinvest or return to shareholders)
Other factors include durable competitive advantages like strong brands or patents, and management’s ability to deploy capital wisely. When combined with a broader understanding of the industry landscape, these factors give a clear view of what makes a company worth owning.
The Importance of Fundamental Analysis
Not every stock that is popular is worth the price. Markets are noisy. Companies are complex. Fundamental analysis lets you look beyond the headlines and valuations to understand what a company is truly worth and whether the market is pricing it fairly.
Helps In Making Informed Investment Decisions Based On Business Reality
Instead of jumping on trends, fundamental analysis digs into the heart of a business. We examine the income statement, growth patterns, and debt structure to understand if the company is actually performing well.
When prices don’t reflect this reality—either too high or too low—opportunities emerge. It’s about identifying those mismatches by paying attention to what the numbers and business strategy are telling us, supported by reliable data for fundamental analysis.
Studying things like management quality and industry conditions helps complete the picture and adds depth to our view of a company’s future.
Strengthens Long-Term Investment Strategies
Investors like Buffett have used this method to great effect, focusing on the company’s long-term strength rather than reacting to daily price moves. They buy when the business looks undervalued and hold while it grows.
Success over the long run typically comes from finding companies that are resilient, well-managed, and financially strong. Those qualities tend to signal durability, far beyond what short-term trends can predict.
By focusing on historical consistency and the company’s direction, we align our investments with long-term wealth-building.
Helps Avoid Market Hype And Emotional Investing
When headlines trigger fear or excitement, fundamental analysis helps you stay centered. It pushes you to ask, “Is this price justified by what the business is doing?”
These moments often expose where sentiment diverges from reality. If you’ve done the work, it’s easier to stay calm during turbulence and resist the urge to chase or dump stocks based on noise.
By focusing on facts—revenue, cash flows, margins—you stay grounded even when others are driven by emotion.
Real-World Examples Of Successful Fundamental Analysis Application
Amazon’s core numbers, like its revenue growth and dominance in logistics and cloud, told a compelling story long before its stock reflected that.
Apple’s consistent profits, huge cash reserves, and brand strength revealed it was more than a gadget maker. It was a company with deep customer loyalty and margin strength.
Microsoft’s pivot to cloud services began showing up in key metrics before its stock took off. Those who noticed early by studying the fundamentals reaped the rewards.
From Amazon to Microsoft, these companies were identified early by investors who understood the importance of fundamental analysis, not just flashy headlines.
Types Of Fundamental Analysis
There’s more than one way to approach fundamental analysis. Whether you begin with the economy or zoom in on individual companies, each method proves the importance of fundamental analysis and gives you a different lens through which to evaluate potential investments.
Top-Down Approach (Economy → Sector → Company)
Start broad. Look at GDP, interest rates, and other economic signals to gauge where the economy is heading.
Then drill into industries that tend to perform well under those conditions. Some sectors benefit from growth, others from defensive strength during downturns.
Finally, pick companies within those sectors that have strong financials, operational excellence, and durable advantages.
For example, during periods of rising interest rates, you might narrow in on financial services, which often benefit from improved margins. From there, you could identify a well-managed regional bank with consistent earnings and low loan defaults. One that stands out from the pack.
Bottom-Up Approach (Company → Sector → Economy)
Flip the script. This method starts with individual businesses—searching for companies that are thriving regardless of what the broader market’s doing.
You look closely at things like profit margins, unique value propositions, and balance sheet strength. Once that’s done, you assess how the broader sector and economy support or challenge the company’s success.
For instance, during a broader market slump, you might spot a company like Shopify showing resilience through strong recurring revenue and a loyal customer base, signs that suggest long-term potential even when sentiment is low.
This approach centers on finding strong businesses and letting them lead your portfolio decisions.
Quantitative Vs. Qualitative Analysis Methods
Quantitative: Numbers drive this side—ratios like P/E or ROE, trends in revenue, and liquidity metrics. These allow easy comparison across companies.
For example, spotting a company with a consistently high ROE may signal operational efficiency worth a deeper look, even if the stock isn’t trending in the news.
Qualitative: This digs into leadership quality, brand recognition, innovation capacity, and governance standards—factors that may not show up in spreadsheets but often shape future performance.
For example, a company like Patagonia might not always shine through pure numbers, but its unique marketing strategy, brand loyalty and ethical governance can play a powerful role in long-term value.
Hybrid Approaches For Comprehensive Evaluation
Combining two strategies gives you a wider lens. You might screen for strong quantitative signals, then filter through a qualitative lens to find companies that also have leadership vision or brand value.
For instance, you could shortlist stocks with high free cash flow and solid profit margins, then eliminate those with weak leadership track records or low customer satisfaction ratings.
You’re not locked into one method. By layering the top-down approach and bottom-up method with both numbers and narratives, you sharpen your ability to spot genuine opportunities.
Financial Statement Analysis
To really understand how a company is doing, you need to know how to read its financial documents. These aren’t just reports, they’re maps to the company’s current health and future potential.
Balance Sheet Examination
Think of the balance sheet as a snapshot showing what the company owns and owes at a given time. It shows whether the business is built on solid footing or carrying risky levels of debt.
Assets tell us what the company uses to generate returns. Liabilities tell us what it must pay back. Equity shows what belongs to shareholders. A growing equity position usually reflects retained earnings and effective operations.
Income Statement Insights
Here we get a moving picture of how the company performed over a period.
Revenue trends show us if the company is growing. Operating margins indicate whether it’s controlling costs. Net income tells us what’s left after everything else. The steadier and more upward these lines trend, the more dependable the business tends to be.
Cash Flow Statement Assessment
This is where we move from theory to reality. Cash flow shows what’s actually coming in and going out.
Strong operating cash flow shows the business model works. Investment cash flow reveals where the company is placing its bets. Financing flows expose how much it’s relying on loans or investor money.
If you want to know whether profits are real, the cash flow statement is your best friend.
Financial Ratio Analysis
These ratios give us context and comparison. Liquidity ratios show if the company can meet short-term obligations. Profitability ratios tell us how well it’s using its assets to generate returns.
Whether it’s current ratio, ROE, or gross margin—each metric has a story to tell. Used together, they highlight patterns and warn of risks.
Qualitative Analysis Components
Beyond the numbers lies the story of a company—its leadership, strategy, and resilience. These intangible traits often shape whether financial success will last.
Business Model Evaluation
A business model reveals how the company earns money and sustains profits. Look at how many revenue streams exist, whether income is recurring, and what the cost structure looks like.
Strong models are built on value creation, repeat business, and scalable operations. The more durable and efficient the model, the more likely it is to keep generating cash.
Management Quality Assessment
The leadership team steers the ship. Do they allocate capital wisely, communicate openly with shareholders, and have a track record of solid execution?
Their decisions, good or bad, shape everything from product direction to investor returns. Evaluating their choices and values helps you anticipate how the company might navigate future challenges.
Competitive Advantage Analysis
Why can this company keep winning?
Moats might come from network effects, switching costs, or patent protection. If the brand is strong and customers stick around, that’s worth more than short-term market gains.
The bigger and deeper the moat, the harder it is for rivals to catch up.
Industry And Sector Analysis
Context matters. Some industries grow fast, others are slow but stable. Regulations, market concentration, and tech disruption all influence how a business performs.
Knowing how these forces affect the company helps you judge its upside—and its risks.
Valuation Methods And Metrics
Before buying a stock, you want to know if the price makes sense. Valuation helps answer that by showing whether the stock is underpriced or overhyped.
Absolute Valuation Models
Discounted Cash Flow (DCF) is the go-to here. It forecasts future free cash flows and discounts them back to today’s value. You’re essentially asking: what would I pay today for the company’s future profits?
Inputs matter. Revenue forecasts, margins, reinvestment needs—all shape the outcome. Done right, it gives a detailed picture of fair value.
Investor Insight: DCF tends to work best for mature companies with predictable cash flows, not early-stage tech plays.
Relative Valuation Metrics
This method compares companies side by side using standard ratios. P/E tells you how the market values earnings. P/B reveals how market value compares to book value.
EV/EBITDA gives a clean look at operating earnings. These benchmarks work best when comparing companies in the same industry.
Pro Tip: When comparing tech stocks, EV/EBITDA can offer more clarity than P/E, especially if some companies are reinvesting heavily and showing lower net earnings.
Growth-Based Valuation
Growth expectations shift value. A high-growth company might justify a higher P/E ratio. We use the PEG ratio to see if the price aligns with the expected growth.
Market share expansion, new product launches, and geographic reach are all growth drivers that influence what the stock should be worth.
Example: A company like MercadoLibre might trade at a high P/E, but if it’s consistently growing revenue at 30%+ annually with a solid runway in Latin America, the PEG ratio can help determine if the price still makes sense.
Margin Of Safety Concept
No valuation is perfect. The margin of safety builds in a cushion for errors or surprises. Buying well below intrinsic value protects you from downside while still offering upside.
The more stable the business, the smaller the cushion required. But in uncertain sectors, that buffer becomes even more important.
Investor Insight: Legendary investor Benjamin Graham often looked for a 30–50% margin of safety. That might be overkill for some blue-chip names today, but it’s still a smart compass for navigating risk.
Practical Application Of Fundamental Analysis
Developing a disciplined process highlights the ongoing importance of fundamental analysis—it turns scattered data for fundamental analysis into actionable insights. Fundamental analysis is only useful if applied consistently. A thoughtful process, good sources, and awareness of common traps can improve your results and keep emotions in check.
Developing A Systematic Approach
Create a checklist. Use standard financial ratios to screen potential investments. Develop a scoring model to rate companies on both metrics and intangibles.
Write down your reasoning for each investment—what you saw, why you believed in it. Over time, this builds discipline and helps refine your edge.
A repeatable process helps you focus, compare companies consistently, and avoid falling in love with your ideas.
Information Sources And Research
Start with what the company provides—annual and quarterly reports. Go deeper with interviews, analyst insights, and third-party research.
Free or paid, the goal is the same: build a full picture. Always verify across sources and read the fine print—footnotes often hold critical clues.
Common Pitfalls And How To Avoid Them
Ignoring the importance of fundamental analysis leads many investors astray. Instead of chasing trends, lean on sound data and proven methods. Focusing on just one metric is risky. Instead, zoom out and use a variety of indicators to get the full view.
Avoid filtering out contrary opinions. It’s easy to fall into the trap of only seeking confirmation. Instead, challenge your views and explore what could go wrong.
Other common traps: misreading short-term data, ignoring industry trends, or freezing when there’s too much info. Simplify your process, but stay thorough.
Fundamental Analysis Is Your Ultimate Investment Compass
The importance of fundamental analysis is timeless. Fundamental analysis is the difference between guessing and knowing. It helps investors shift from reacting to market noise to understanding the real drivers of a company’s value. These include financial performance, leadership, industry position, and economic context.
It combines hard numbers with deeper context, using tools like financial ratios, balance sheets, and income statements, and data for fundamental analysis, alongside qualitative factors like management quality and industry dynamics. Many successful investors also explore the complementary use of fundamental analysis and technical analysis, leveraging both deep business insights and market behavior patterns to make well-timed, informed decisions.
New to fundamental analysis or trying to sharpen your process? Daloopa helps by automating the time-consuming part—collecting and updating financial data. Start using Daloopa today and make every step of your analysis more efficient.


