
Are you making the wrong call just because you’re looking at the wrong metric?
Business decisions succeed or fail on timing. Zoom out too far and you’ll miss the early signs of trouble. Zoom in too close and you might mistake patterns for progress. Year-over-Year (YOY) and Quarter-over-Quarter (QOQ) growth metrics shape how teams interpret success, allocate resources, and spot risks. Used in isolation, each metric tells only part of the story. But when you combine them, you get the clarity to act fast and plan wisely. YOY filters out seasonal distortion to show long-term trends. QOQ zeroes in on short-term shifts and momentum. Teams that pair both gain a fuller picture and make stronger calls because of it. If you’re committed to high-quality business performance analysis, you can’t afford to overlook the value of YOY and QOQ.
Key Takeaways
- Together, these growth metrics give a balanced view of company growth
- YOY offers clarity on consistent growth patterns, minus seasonal noise.
- QOQ tracks how recent decisions and market shifts play out.
Breaking Down Time-Based Performance Metrics
Time-based comparisons tell you more than just what changed, they reveal when and why. These benchmarks guide smarter choices by showing how metrics shift over specific intervals. This is why YOY and QOQ remain essential tools for evaluating companies across industries.
YOY and QOQ Metrics Explained
Year-over-Year (YOY) compares the same time period from one year to the next, usually in percentage terms. Think Q2 2025 revenue compared to Q2 2024.
Quarter-over-Quarter (QOQ) captures progress between consecutive quarters. It’s helpful for monitoring short-term momentum.
If you lean too hard on YOY, you might miss early signs of a downturn. Rely too much on QOQ, and you might misinterpret a seasonal dip as failure. Smart teams balance both. For example, if your Q2 sales are down 8% QOQ but up 12% YOY, you know you’re not in crisis. You’re in a seasonal trough with healthy year-long momentum.
The shared formula is:
Percentage Change = ((Current Period – Previous Period) / Previous Period) × 100
Importance of Time-Based Comparisons in Business Analytics
These comparisons filter out timing quirks and cyclic trends. YOY offers a cleaner view of consistent patterns, cutting through fluctuations caused by seasonal highs and lows.
QOQ digs into shorter windows, surfacing quick changes and the results of new strategies. These insights help teams adapt their approach faster—an absolute must in agile business performance analysis.
Picture this: Your quarterly ad spend ROI just dropped. Instead of panicking, you pull the annual numbers, and it turns out that it’s a repeat seasonal dip that always rebounds in Q3. Without both views, you could have killed a working campaign. That’s the risk when your tools for evaluating companies lack the right time frame lens.
You can use time-based metrics to:
- Recognize repeatable cycles
- Validate strategy impact
- Chart sustainable growth
- Compare different timelines effectively
- Avoid reactionary decisions that sabotage long-term wins
The best approach combines both YOY and QOQ so your business isn’t flying blind to short- or long-term realities. Public companies like Amazon, for example, often present both annual growth (for long-term trends) and quarterly changes (for recent momentum) in their investor disclosures to provide a holistic financial picture.
The Long View Advantage in YOY Analysis
YOY shines when you need to account for cyclical behaviors. By holding the time of year constant, it highlights durable growth or contraction.
Benefits of YOY include:
- Dampens seasonal spikes
- Clarifies big-picture shifts
- Frames decisions in a historical view
- Informs long-range planning
Its longer lens also helps avoid overreacting to short-term noise or temporary swings. Say your customer acquisition cost (CAC) jumped in Q1 2025. YOY comparison tells you it always does, and by Q2 it normalizes. Having that context prevents you from slashing budgets or pivoting too soon.
The drawback is that it lags. If you launch a new service, YOY will not catch performance dips until it’s too late to course-correct. You cannot rely on YOY alone, especially if you are reporting to execs who want fast updates.
The Real-Time Edge of QOQ Analysis
QOQ excels at showing fast feedback. If your team just launched a product, this metric will tell you how it performed next quarter. The results are even more powerful when adjusted for recurring seasonal effects.
QOQ is especially valuable for:
- Spotting operational pivots
- Measuring fresh campaign outcomes
- Tracking fast-moving metrics
- Surfacing early signals
Say your Q1 paid search campaign brings in 20% fewer leads than Q4. YOY numbers still look solid, so leadership assumes it’s business as usual. But the quarterly view shows this drop is unusual for this time of year. That’s your early warning that something has changed. Maybe a competitor outbid you, or your ad creative is underperforming. Without the quarterly signal, you’d miss the shift, stay the course, and fall short on your Q2 targets.
But the downside is volatility. One off-month can look like a trend. If you’re not accounting for seasonality, you risk pulling the plug on something that’s actually working or doubling down on something that’s peaking temporarily.
Strategic Applications of Time-Based Metrics
Picking the right metric helps you track what matters and move from raw data to actionable insight, whether you’re in finance, ops, or marketing. However, relying on the wrong time frame can lead to misaligned strategy, inaccurate reporting, and wasted resources. The stakes are high, especially when decisions hinge on flawed interpretations.
Comparative Analysis: When to Use YOY Vs. QOQ
YOY is great for uncovering steady trends and taking seasonality out of the picture. If your business ebbs and flows by the calendar, YOY keeps those swings in check.
QOQ is sharper at gauging how recent changes are panning out. It’s ideal for evaluating new product launches, hiring surges, or pricing tests.
Let’s say you just rolled out a new pricing model in Q2. YOY won’t catch the effects until Q2 next year, too late to fix what’s broken. QOQ gives you feedback in real time.
Your choice of metric should reflect your goal:
- YOY: For setting yearly goals, evaluating brand growth, or comparing with industry averages
- QOQ: For testing new strategies, managing rapid growth, or reacting to market shifts
Misalignment here can be costly. Use YOY to judge a fast-moving campaign, and you won’t see those early warning signs. Use QOQ to gauge year-over-year brand growth, and you’ll overreact to noise.
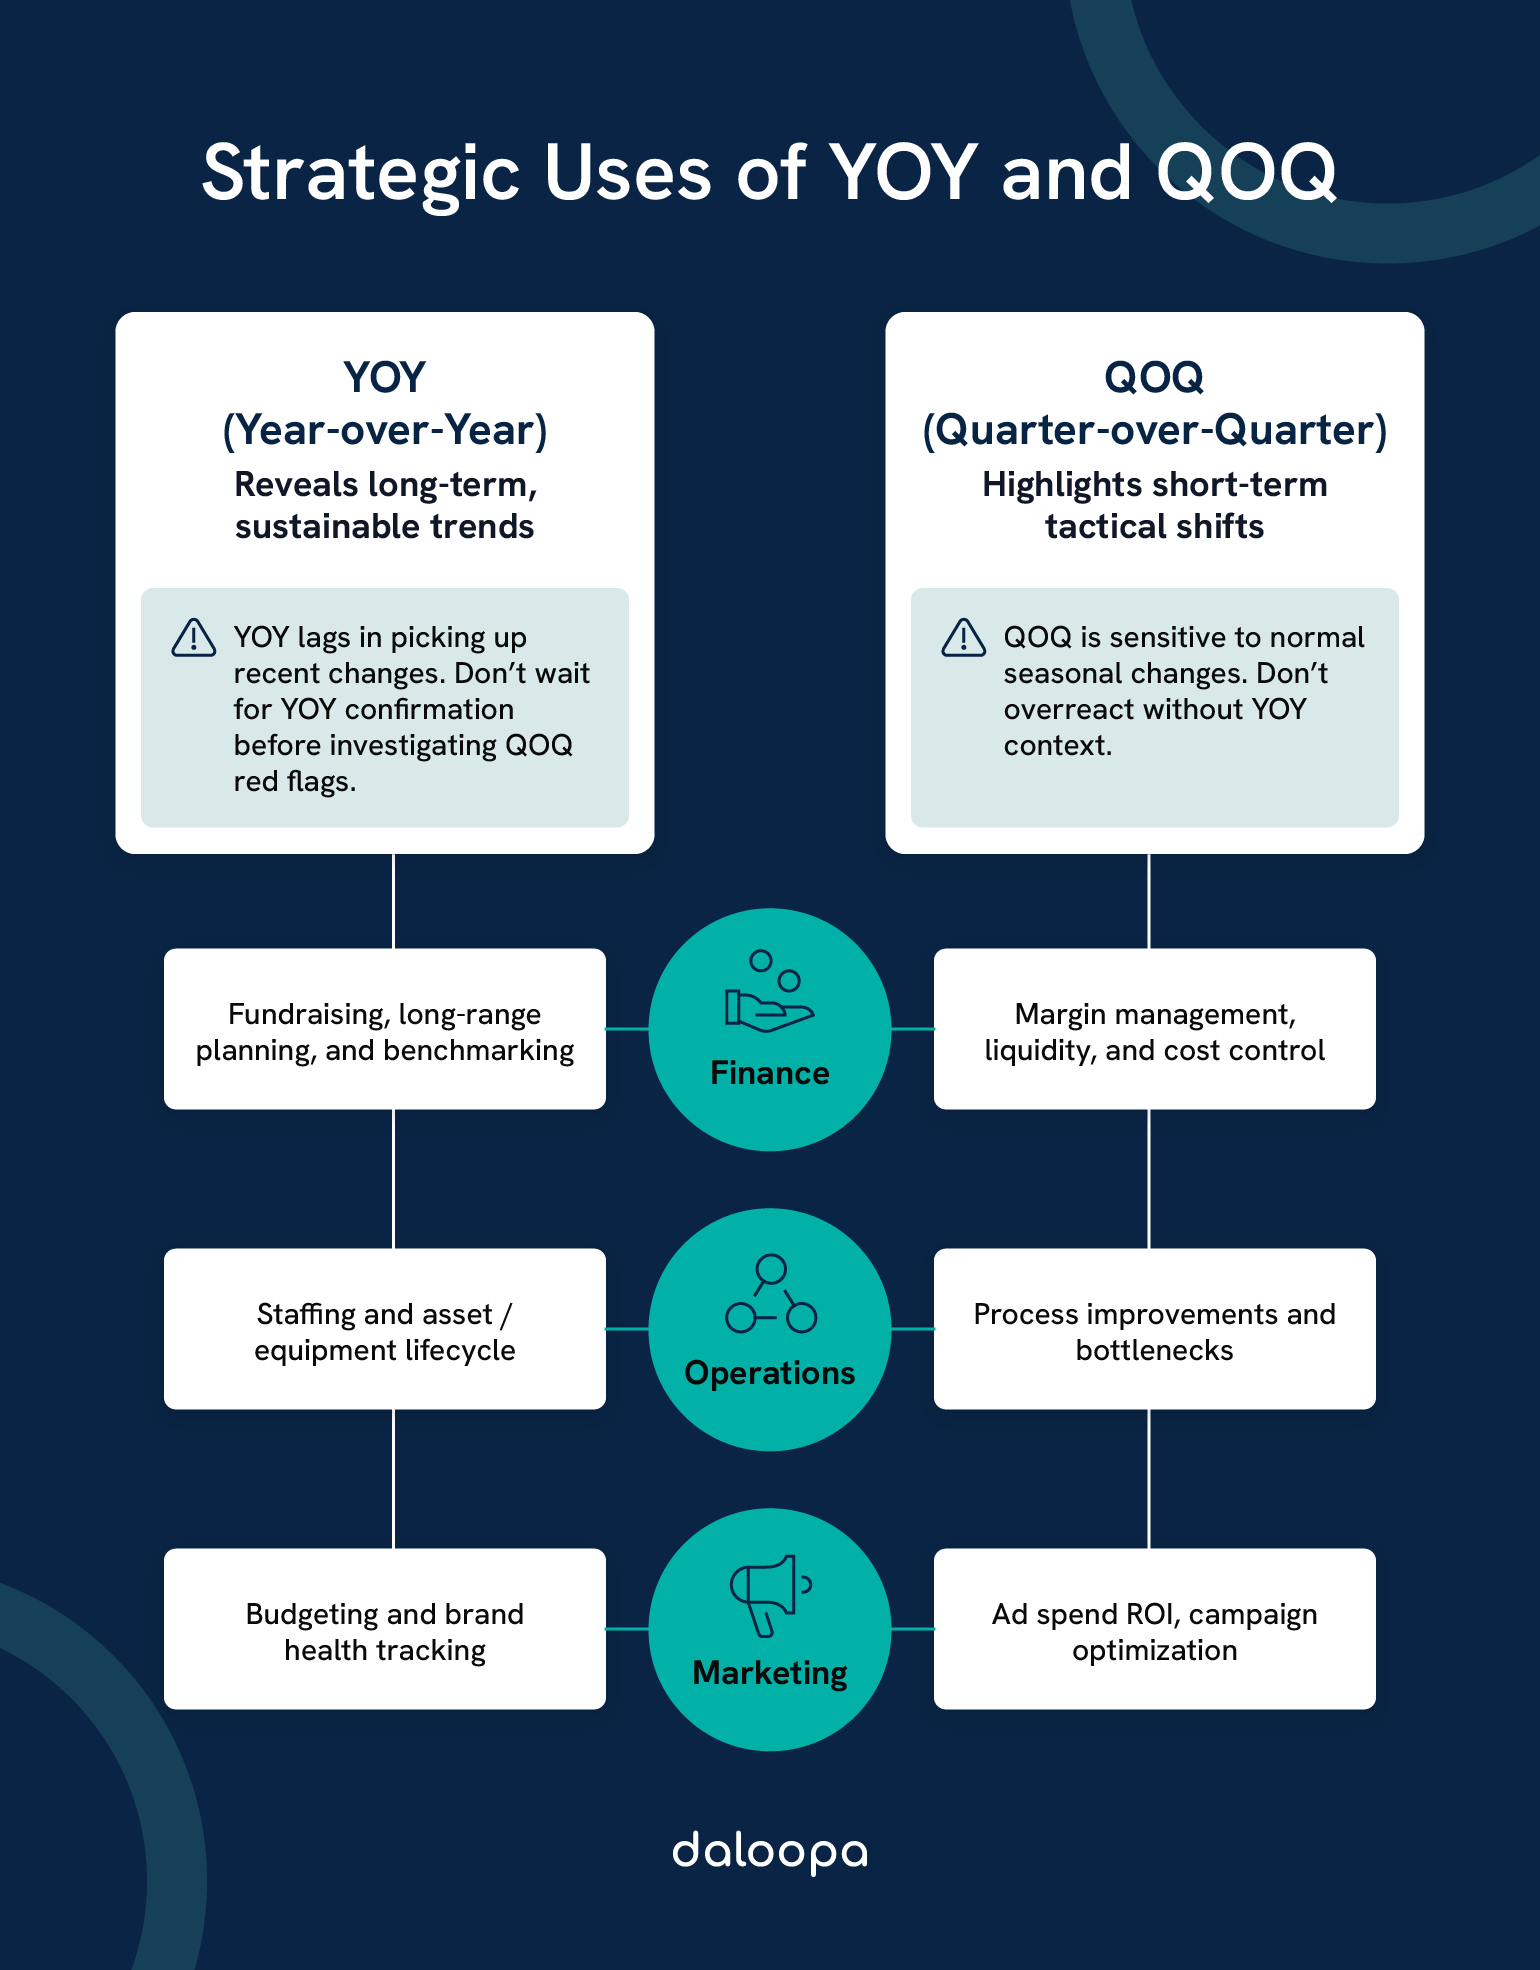
Financial Performance Evaluation
Finance teams need both views to paint a full picture. YOY helps flag dependable growth and larger financial patterns.
QOQ sharpens your lens on:
- Profit margins over short periods
- Month-to-month revenue shifts
- Operational cost tweaks
- Liquidity and capital movement
Consider this scenario: YOY performance shows stable growth, but a QOQ view reveals a two-quarter decline in margin. That drop may indicate early signs of inefficiency or rising costs, issues a YOY-only view might delay uncovering until they escalate. That’s the kind of insight only dual-metric tools for evaluating companies can provide.
While YOY supports planning and fundraising, QOQ enables fine-tuning day-to-day decisions and catching sudden changes.
Marketing and Sales Performance Tracking
Marketers lean on both timelines to guide campaign planning. QOQ gives a quick read on recent ad spends and customer responses.
If Q1 click-through rate drops 30% from Q4, YOY might say, “No big deal, it always dips here.” But QOQ says, “Something’s different this time.” Without both, you won’t know if it’s a pattern or a problem.
Meanwhile, YOY helps with:
- Benchmarking seasonal performance
- Budgeting marketing efforts
- Planning big promotions
- Gauging brand health year after year
Sales teams use QOQ to refine quotas and strategies in real time. YOY data helps set realistic forecasts and shape go-to-market plans. In high-growth environments, using both is critical for accurate business performance analysis.
Operational Performance Monitoring
Operations leaders benefit from the dual lens as well. QOQ helps them respond to bottlenecks or efficiency dips in areas like:
- Factory throughput
- Quality assurance
- Logistics speed
- Team productivity
On the other hand, YOY analysis helps spot:
- Long-term staffing needs
- Equipment lifecycle patterns
- Shifts in baseline performance
These metrics work together to keep performance grounded in both real-time visibility and long-range sustainability.
Advanced Analytical Applications
Today’s analytics platforms draw from both QOQ and YOY to build smarter predictions. Machine learning models rely on both inputs for better accuracy. If your analytics stack is missing either, it’s time to reassess your tools for evaluating companies.
These techniques power:
- Automated alerts on data trends
- Forward-looking risk projections
- Peer performance comparisons
- Market potential scoring
Feeding only short-term data into forecasting models can make outputs jumpy and unreliable. Relying exclusively on annual patterns creates lag. The most reliable projections come from models trained on both, balancing immediacy with consistency.
With this mix of metrics, analysts can see the present in context and predict what’s coming next with greater confidence.
Use Both Metrics or Risk a One-Sided View
If you’re only looking at YOY, you’re too late to respond. If you’re only looking at QOQ, you’re too quick to react. Smart decision-making needs both. Together, they reduce guesswork, surface trends faster, and help teams avoid costly misreads. Businesses that integrate both are better equipped to respond to what’s happening now while staying aligned with long-term goals and conducting more effective business performance analysis.
Daloopa automates your time-based financial data so you can focus on analysis and not data hunting. Use it to keep your models up to date with the metrics that drive smarter decisions. Choose a plan today to get started.


