
Manually wrangling earnings reports in Excel steals hours from analysis. Modern AI workflows extract numbers, reconcile line items, and generate presentation-ready outputs inside your spreadsheets so you can act faster and with fewer mistakes. This is where AI-powered earnings report analysis comes in, transforming your daily workflow and helping you focus on insights rather than repetitive tasks.
Key Takeaways
- Automating with AI in Excel reduces human input errors and compresses analysis time from hours to minutes.
- Machine learning and NLP integrate into standard Excel processes without requiring advanced programming knowledge.
- Automated modeling and forecasting speed the discovery of earnings-related risks and opportunities.
The Evolution Of Earnings Report Analysis
You used to spend the early morning copying figures from PDFs into Excel, reconciling formulas, and checking footnotes by hand. Now you can connect Excel to live pipelines that ingest filings, parse XBRL tables and narrative text, and populate structured models automatically—so analysis starts where it should: interpretation. This evolution underscores why AI-powered earnings report analysis is quickly becoming the standard for FP&A professionals.
Traditional Manual Methods Vs. AI-Augmented Approaches
Manual workflows rely on copy/paste, ad-hoc mappings, and version juggling—processes that scale poorly and invite simple but costly errors. AI-augmented methods extract tables, tag line items, and normalize labels, then feed clean datasets into refreshable models and dashboards. That change reduces transcription risk and shifts your day toward variance analysis and strategic recommendations.
| Method | Data Entry | Error Risk | Update Speed |
| Manual | Manual typing/pasting | High | Slow |
| AI-Augmented | Automated extraction | Lower | Near real-time |
How AI Is Transforming Financial Data Processing In Excel
AI replaces rote work and enforces consistent validation rules across datasets. It extracts numeric XBRL values, maps varied labels into a standardized chart of accounts, and summarizes qualitative disclosures with NLP so you can trust inputs before modeling.
- Classification models tag and map line items automatically.
- NLP condenses management commentary into driver summaries.
- Anomaly detection flags outliers before they corrupt forecasts.
By automating financial data in Excel, analysts get accurate inputs faster, enabling better business decisions.
Automating SEC Filing Data Acquisition
Connect your Excel queries to EDGAR or a commercial filings API so filings arrive as structured JSON/XBRL rather than as PDFs you must rekey. The SEC publishes developer resources and an EDGAR API to support programmatic access to filings and extracted XBRL. Automating retrieval eliminates manual downloads and anchors your data to the official source.
Parsing Structured And Unstructured Financial Data
Use XBRL parsers for numeric tables and NLP for narrative sections (management discussion, MD&A, risk factors). Combining both gives you a complete dataset—numbers for models, language for sentiment and guidance extraction.
Creating Persistent Data Connections For Real-Time Updates
Persistent connections (API, ODBC, or cloud datasets) let you push updates into Excel with scheduled refreshes or event triggers—so models stay current and dashboards reflect filings as they arrive.
For example, a database ingesting EDGAR filings can push updates directly to Excel models, letting teams act on disclosures in near real time.
Implementing AI-Powered Data Extraction in Excel
You can build a practical pipeline without ripping up your existing models. This is where AI-powered data extraction in Excel shines, ensuring that filings and disclosures feed directly into structured templates without manual intervention. Pairing this with AI-powered earnings report analysis gives analysts speed, confidence, and transparency.
Power Query Method
While Power Query is a powerful tool for the job, it requires technical expertise to set up connections, parsing rules, and transformation logic. An analyst using this method would have to build and maintain data pipelines and workflows to clean, normalize, and structure the data into a usable table.
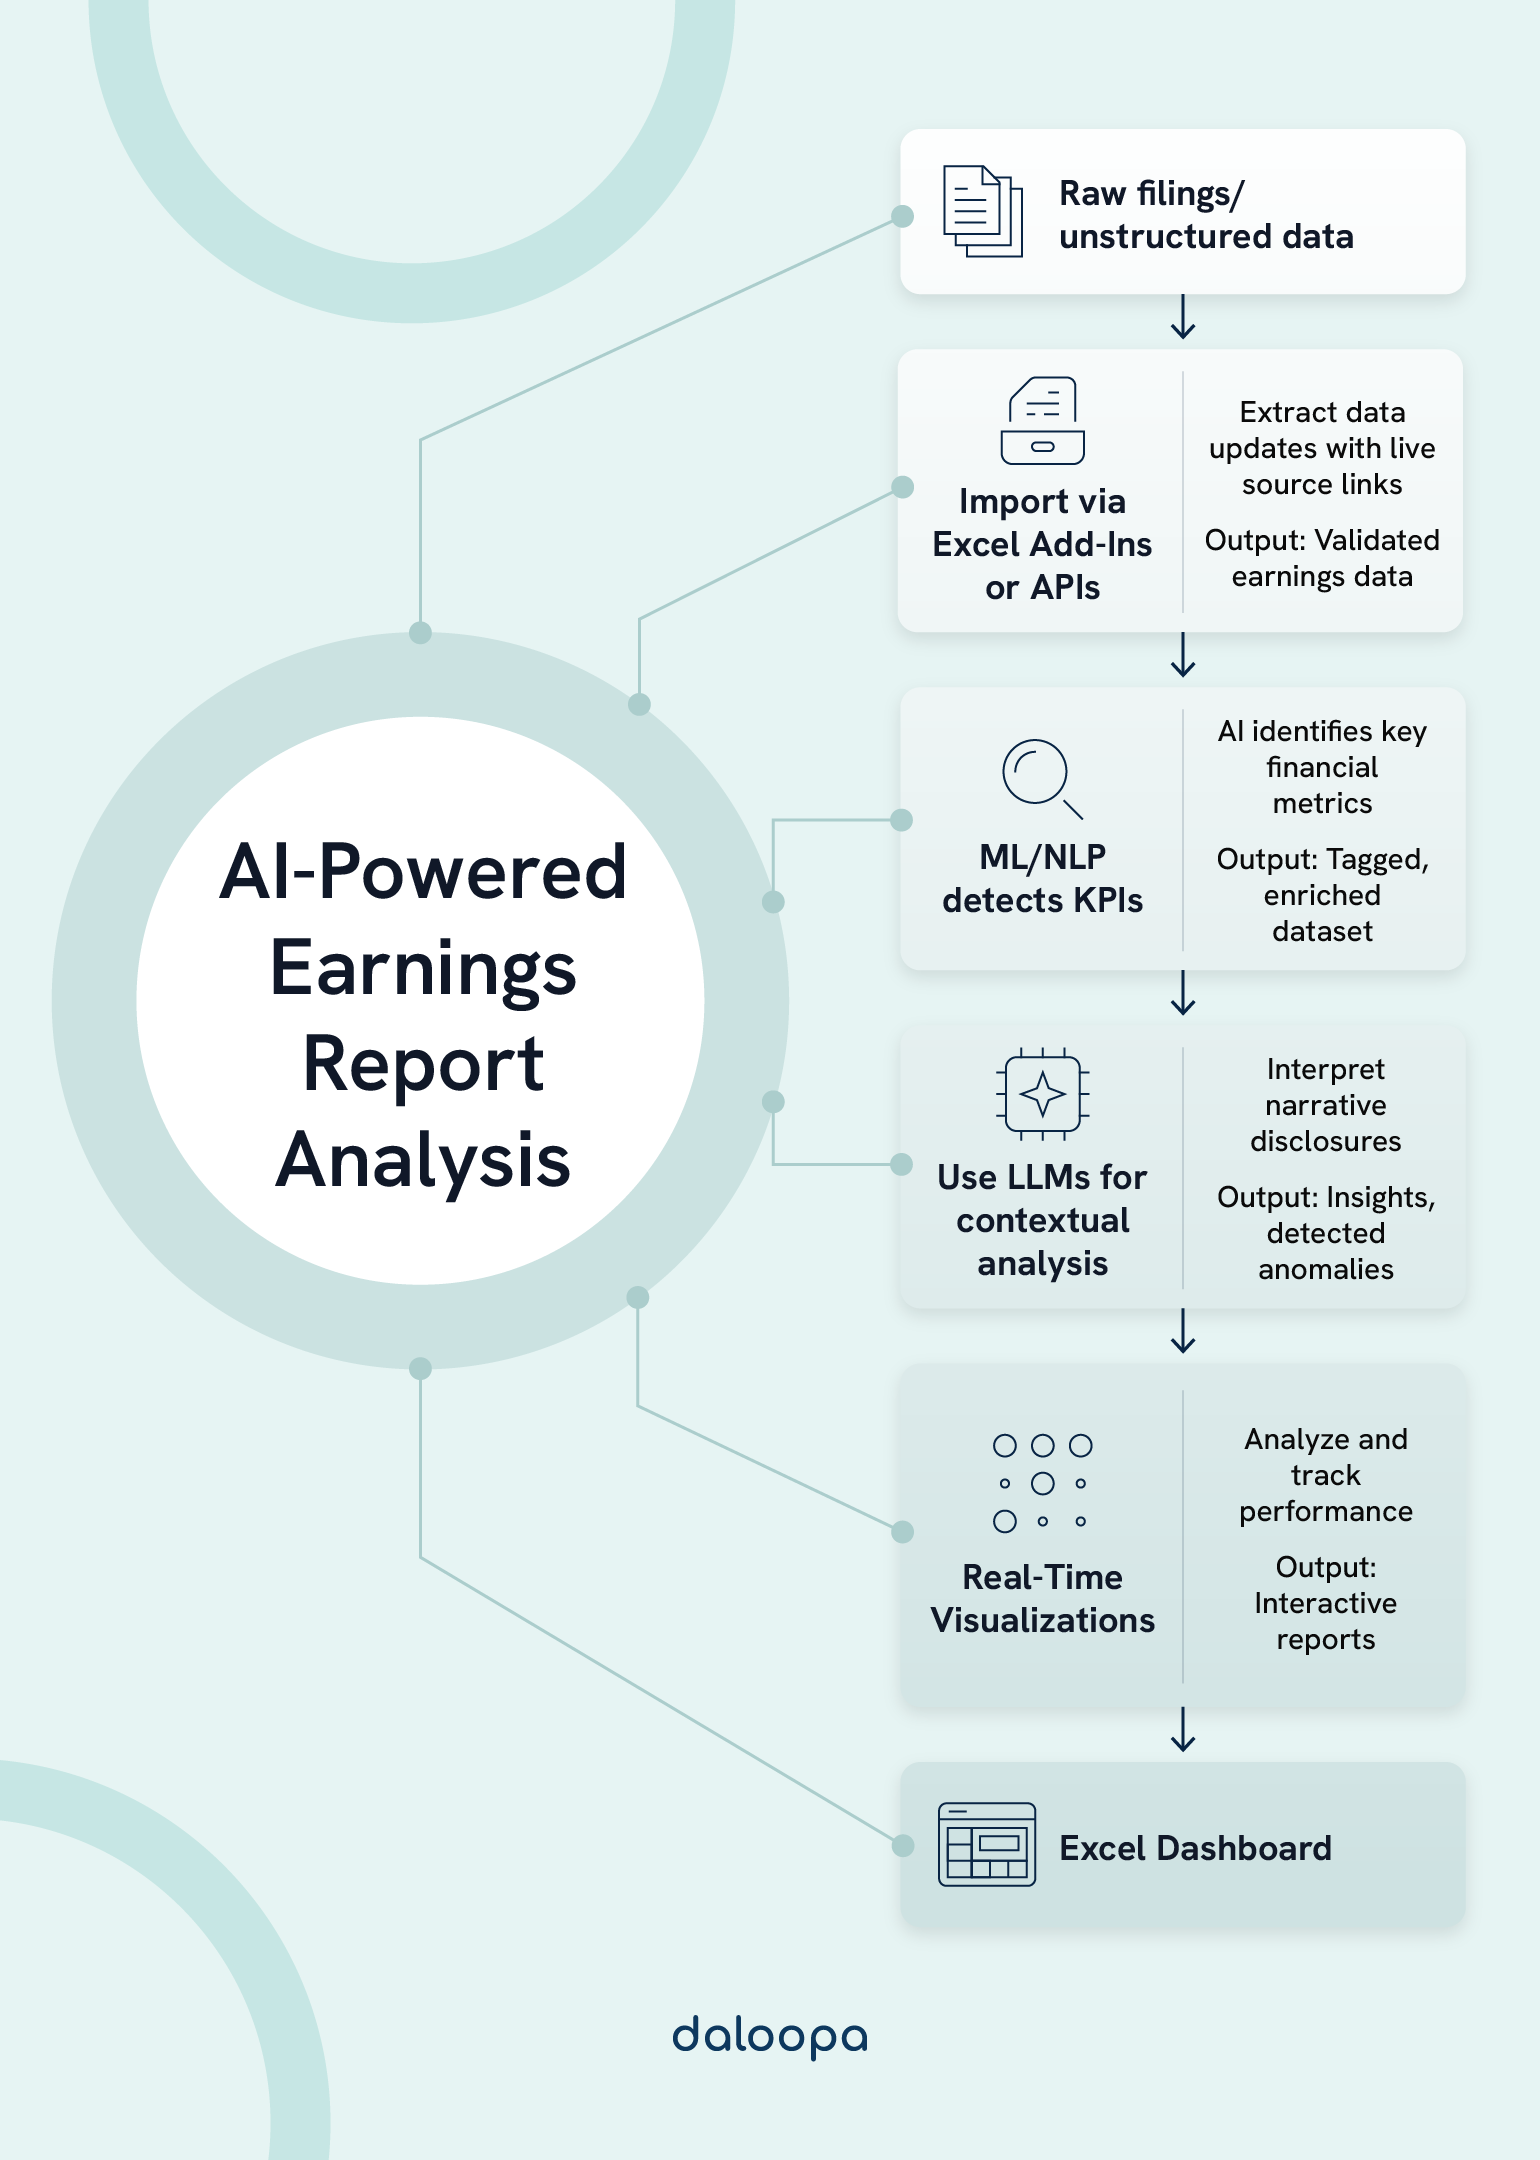
The typical flow is: ingest → tag → normalize → load → analyze.
- Import: Import raw filings or report snapshots (Power Query, APIs).
- Detect: Apply ML/NLP tagging to detect revenue, EPS, and segment notes.
- Transform: Normalize into structured tables and link to your template.
- Analyze: Refresh dashboards and run anomaly checks automatically.
| Step | Tool | AI Role | Output |
| Import | Power Query | None | Raw report data |
| Detect | ML/NLP | Identify metrics | Tagged dataset |
| Transform | Power Query + AI rules | Clean & normalize | Structured table |
| Analyze | Excel formulas / BI tools | Optional | Insights & KPIs |
Excel Add-Ins And Extensions For AI-Powered Analysis
Need a more direct, end-to-end alternative to the multi-step Power Query process? Excel add-ins extend the native environment with automated parsing, reconciliation, and data updates.
Evaluate vendors on accuracy, refresh speed, in-sheet audit trails, and integration with your data ecosystem. It’s best to choose an AI-powered solution that can extract data from public filings and disclosures and handle the complexities of different formats behind the scenes so you can focus on analysis.
Integration Capabilities With Financial Data Providers
Ensure your chosen add-in supports direct pulls from market data and consensus providers or supports custom API integration. That flexibility lets you combine reported numbers with estimates and market signals in one model.
Custom Function Development For Specialized Financial Calculations
If you need bespoke calculations (e.g., custom growth drivers or a proprietary KPI), choose tools that expose Python/JavaScript hooks or allow parameterized functions. That keeps your models flexible while standardizing data ingestion.
AI-Powered Excel Add-Ins and LLMs For Financial Analysis
Look for features like natural-language queries, auto-mapping of line items, variance detection, and auditable links to sources. Recent product upgrades emphasize retrofitting your existing models and simplifying onboarding—so you can connect an add-in to your templates with minimal rework.
Daloopa’s One-Click Model Update With Auditable Hyperlinks
The Daloopa Excel Add-In features seamless insertion of auditable hyperlinks to original source documents for every datapoint, enabling analysts to verify figures quickly without opening multiple external files. This integration ensures full transparency and auditability in financial models.
Additionally, Daloopa’s hyperlink toggle gives users flexible control over these hyperlinks within Excel. Analysts can easily switch hyperlinks on or off to minimize distractions during focused analysis, while still having instant access to source documentation via simple right-click options or by toggling links back on in settings.
This balance of robust automation, easy verification, and customizable workflow control accelerates review cycles and improves confidence in model accuracy.
Daloopa MCP (Model Context Protocol) for LLMs
Large language models integrated via Daloopa’s Model Context Protocol (MCP) can interpret earnings filings and transcripts in Excel with near-human comprehension, accurately identifying forward-looking statements and flagging inconsistencies. For example, when connected with Claude through Daloopa MCP, the LLM gains direct access to the world’s most comprehensive and audited financial dataset, enabling it to parse complex financial documents effortlessly.
By combining Daloopa’s quality-assured fundamental financial data with the computational power of Excel and LLM for financial insights, this approach automates comprehensive earnings report analysis. Daloopa empowers analysts to accelerate research, benchmarking, complex financial modeling, and inflection tracking directly within their familiar spreadsheet environment, significantly reducing manual effort while increasing trust and auditability in AI-driven financial insights.
The Business Case For Automation In Financial Analysis
Automation converts labor hours into analytic bandwidth. By cutting time spent on ingestion and clean-up, you free analysts to test scenarios, stress models, and deliver decision-ready insights sooner—key competitive advantages in fast markets. Many teams find that automating financial data in Excel not only accelerates analysis but also strengthens governance across their reporting cycles.
Industry surveys show that organizations focusing on workflow redesign and governance capture the most value from AI investments. This demonstrates how AI-powered earnings report analysis creates ROI by minimizing wasted effort.
Time And Cost Savings From Automated Data Extraction
Typical manual tasks—importing, cleaning, and mapping—often consume the bulk of your cycle time. AI pipelines reduce those tasks to minutes, lowering headcount hours for repetitive work and accelerating forecast refresh cadence. AI-powered earnings report sources like Daloopa position one-click updates and automated ingestion as primary time savers.
Example:
| Task | Manual Process Time | Automated Process Time |
| Importing earnings data | 3–4 hours | <15 minutes |
| Cleaning and formatting data | 2 hours | <5 minutes |
Error Reduction And Accuracy Improvements
Automated validation applies consistent reconciliation rules and preserves links back to filings so you can verify numbers quickly. That auditability reduces the risk of restatements and supports faster auditor inquiries. Anchor your automation to authoritative sources (EDGAR/XBRL and standards), combined with AI-powered data extraction in Excel, to preserve compliance and traceability.
ROI Metrics For Implementing AI-Powered Financial Analysis
The business case often rests on measurable gains such as:
- Labor cost savings from reduced manual work
- Cycle time reduction in report preparation
- Lower error rates in reported figures
- Better forecast accuracy in budgeting
Data Cleaning And Validation Automation
Reliable earnings analysis starts with clean, consistent, and well-structured data. AI-driven Excel automation can detect anomalies, standardize formats, reconcile mismatches, and track every transformation to maintain transparency.
AI-Driven Outlier Detection In Financial Datasets
You should train detection models on historical ranges for key metrics (revenue growth, margins, EPS) and then surface anything that falls well outside those expectations. When a new report feeds into your model, the system should flag outliers with context.
Track false positives and confirmed anomalies as feedback to retrain the models, which reduces noise over time and improves precision. Finally, always pair automated flags with a short human description field so reviewers capture the business reason (one-off sale, acquisition, FX shift) for future audits and model training.
Automated Standardization Of Financial Statement Formats
You should codify mapping rules that convert varied line-item labels into a standardized chart of accounts and apply those mappings automatically on ingest. Keep a living mapping table in your system so new or unusual labels get reviewed once and then reused across subsequent filings, avoiding repeated manual remapping.
Preserve the original label and source link alongside the standardized field so you can always trace back to the filing language if a stakeholder needs verbatim wording.
Audit Trail Generation For Data Transformation Processes
You should log every automated transformation, manual override, and formula change with timestamps, user IDs, and before/after values so every step in the numbers’ journey is reversible and reviewable. Store these logs in an exportable format that auditors and compliance teams can ingest directly into their review tools, and surface human-readable summaries that explain major adjustments in plain language.
Visualization And Reporting Automation
AI-powered tools allow us to generate earnings report visuals directly from raw data in Excel. We can connect to multiple data sources, automate refresh schedules, and produce updated charts without manual intervention. This ensures our reports remain current.
Interactive dashboards in Excel let us drill down into specific metrics. We can filter by time period, business unit, or product line, making it easier to spot revenue trends or expense anomalies. These views update automatically when new data is loaded.
Dynamic Dashboard Creation
You can turn static spreadsheets into dynamic dashboards that refresh automatically whenever new data arrives, removing the repetitive step of rebuilding visuals each quarter. Configure scheduled refreshes or event triggers so charts and tables update the moment a new filing, ERP extract, or market data feed lands in your model.
Automated Generation Of Financial KPI Dashboards
You should standardize KPI definitions and let automation populate dashboards from standardized tables, ensuring every stakeholder interprets metrics the same way. By codifying the calculations for EPS, EBITDA margin, and segment revenue, you avoid mismatches between analyst models and investor decks.
Automating the KPI build process reduces formatting errors and ensures your visuals remain consistent across reporting cycles and peer comparisons. Keep a versioned template library so new dashboards inherit validated layouts, reducing rework and speeding stakeholder distribution.
Interactive Drill-Down Capabilities For Financial Metrics
Interactive drill-downs let you start from a headline KPI and click through to the underlying transactions, segments, or journal entries without juggling multiple files. Use slicers, pivot drill paths, and AI-driven category tagging to make the path from summary to source fast and reliable.
Ensure drill logic brings up source snippets and audit links so reviewers can verify the context of a surprising variance quickly. Design drill flows that mirror typical stakeholder questions — by region, product, or time period — so each click advances analysis rather than creating more work.
Risk Analysis And Compliance Applications
You should bake risk assessment into your Excel workflows so it becomes part of every earnings-cycle review rather than an afterthought. AI models can continuously scan both numeric fields and narrative disclosures to flag unusual trends so you don’t discover material issues only after a board deck is printed.
NLP lets you compare free-text disclosures against compliance checklists and surface missing or ambiguous items for review. Pair anomaly detection with rule-based checks tied to standards like IFRS 15 / ASC 606, so flagged items come with a likely classification.
Finally, surface risk metrics are directly displayed on dashboards, so decision-makers see both the signal and the underlying evidence in one place.
Integration With Existing Financial Workflows
Integrating AI-powered earnings report analysis into Excel requires alignment with current processes, system constraints, and team capabilities. Automation should enhance accuracy and speed without disrupting reporting cycles or compliance. A phased approach to automating financial data in Excel ensures minimal disruption while gradually increasing the level of automation across tasks.
Phased Implementation Approaches For AI-Powered Tools
Roll out automation in phases so you manage risk and measure value as you scale.
- Phase 1: Automate low-complexity, high-volume tasks like PDF/XBRL ingestion and label normalization so you quickly capture time savings and build analyst confidence.
- Phase 2: Add reconciliation, anomaly detection, and auditable hyperlinks so you reduce error rates and speed reviews.
- Phase 3: Expand to forecasting, scenario generation, and NLG summaries once the data backbone and governance are mature.
Document each phase—dependencies, sample datasets, acceptance criteria, and rollback plans—so pilots produce repeatable playbooks for other teams or regions.
Balancing Automation With Human Oversight
Treat automation as an efficiency multiplier, not an independent decision-maker. Define explicit review checkpoints where analysts validate AI flags, adjust mapping exceptions, and sign off on any judgmental narrative before external distribution; make those checkpoints lightweight but mandatory for material items.
Maintain a two-way feedback loop: log analyst decisions (false positives, confirmed issues, context) and feed them into your model-retraining process so precision improves over time. Require human review for items tied to accounting judgment—revenue recognition, impairment, or controversial one-offs—so legal and accounting owners stay accountable.
Finally, build a clear escalation path for disagreements between automated outputs and analyst judgment so disputes resolve quickly and become inputs to governance improvements.
Automate Financial Insights in Excel with Daloopa
Daloopa’s Excel add-in lets you retrofit your existing models and populate hard-coded numbers in place—no reformatting required—so you can update full models in one click at each earnings release. This workflow automation within Excel can be complemented by Daloopa MCP, which powers advanced AI tools and large language models with verified, auditable financial data to enhance accuracy and trust in your analysis.
Ready to turn update day into decision day? Request a demo today and pilot one-click updates on a small set of your live models along with Daloopa’s LLM integration — measure cycle-time savings, auditability gains, and error reduction before you scale.


