
Guidance models can dramatically sway market sentiment—yet when you misinterpret them, you risk overlooking critical inflection points that may cost you real money. By mastering how companies craft EPS guidance and how analysts consensus is formed, you’ll sharpen your edge in precise earnings forecasting and anticipating market twists and turns.
Key Takeaways
- Analyst-company alignment sets expectations investors rely on to judge upcoming earnings.
- Disagreements between analyst consensus and management forecasts can reveal overlooked market insights.
- Recognizing these divergences equips investors to make smarter, more informed decisions.
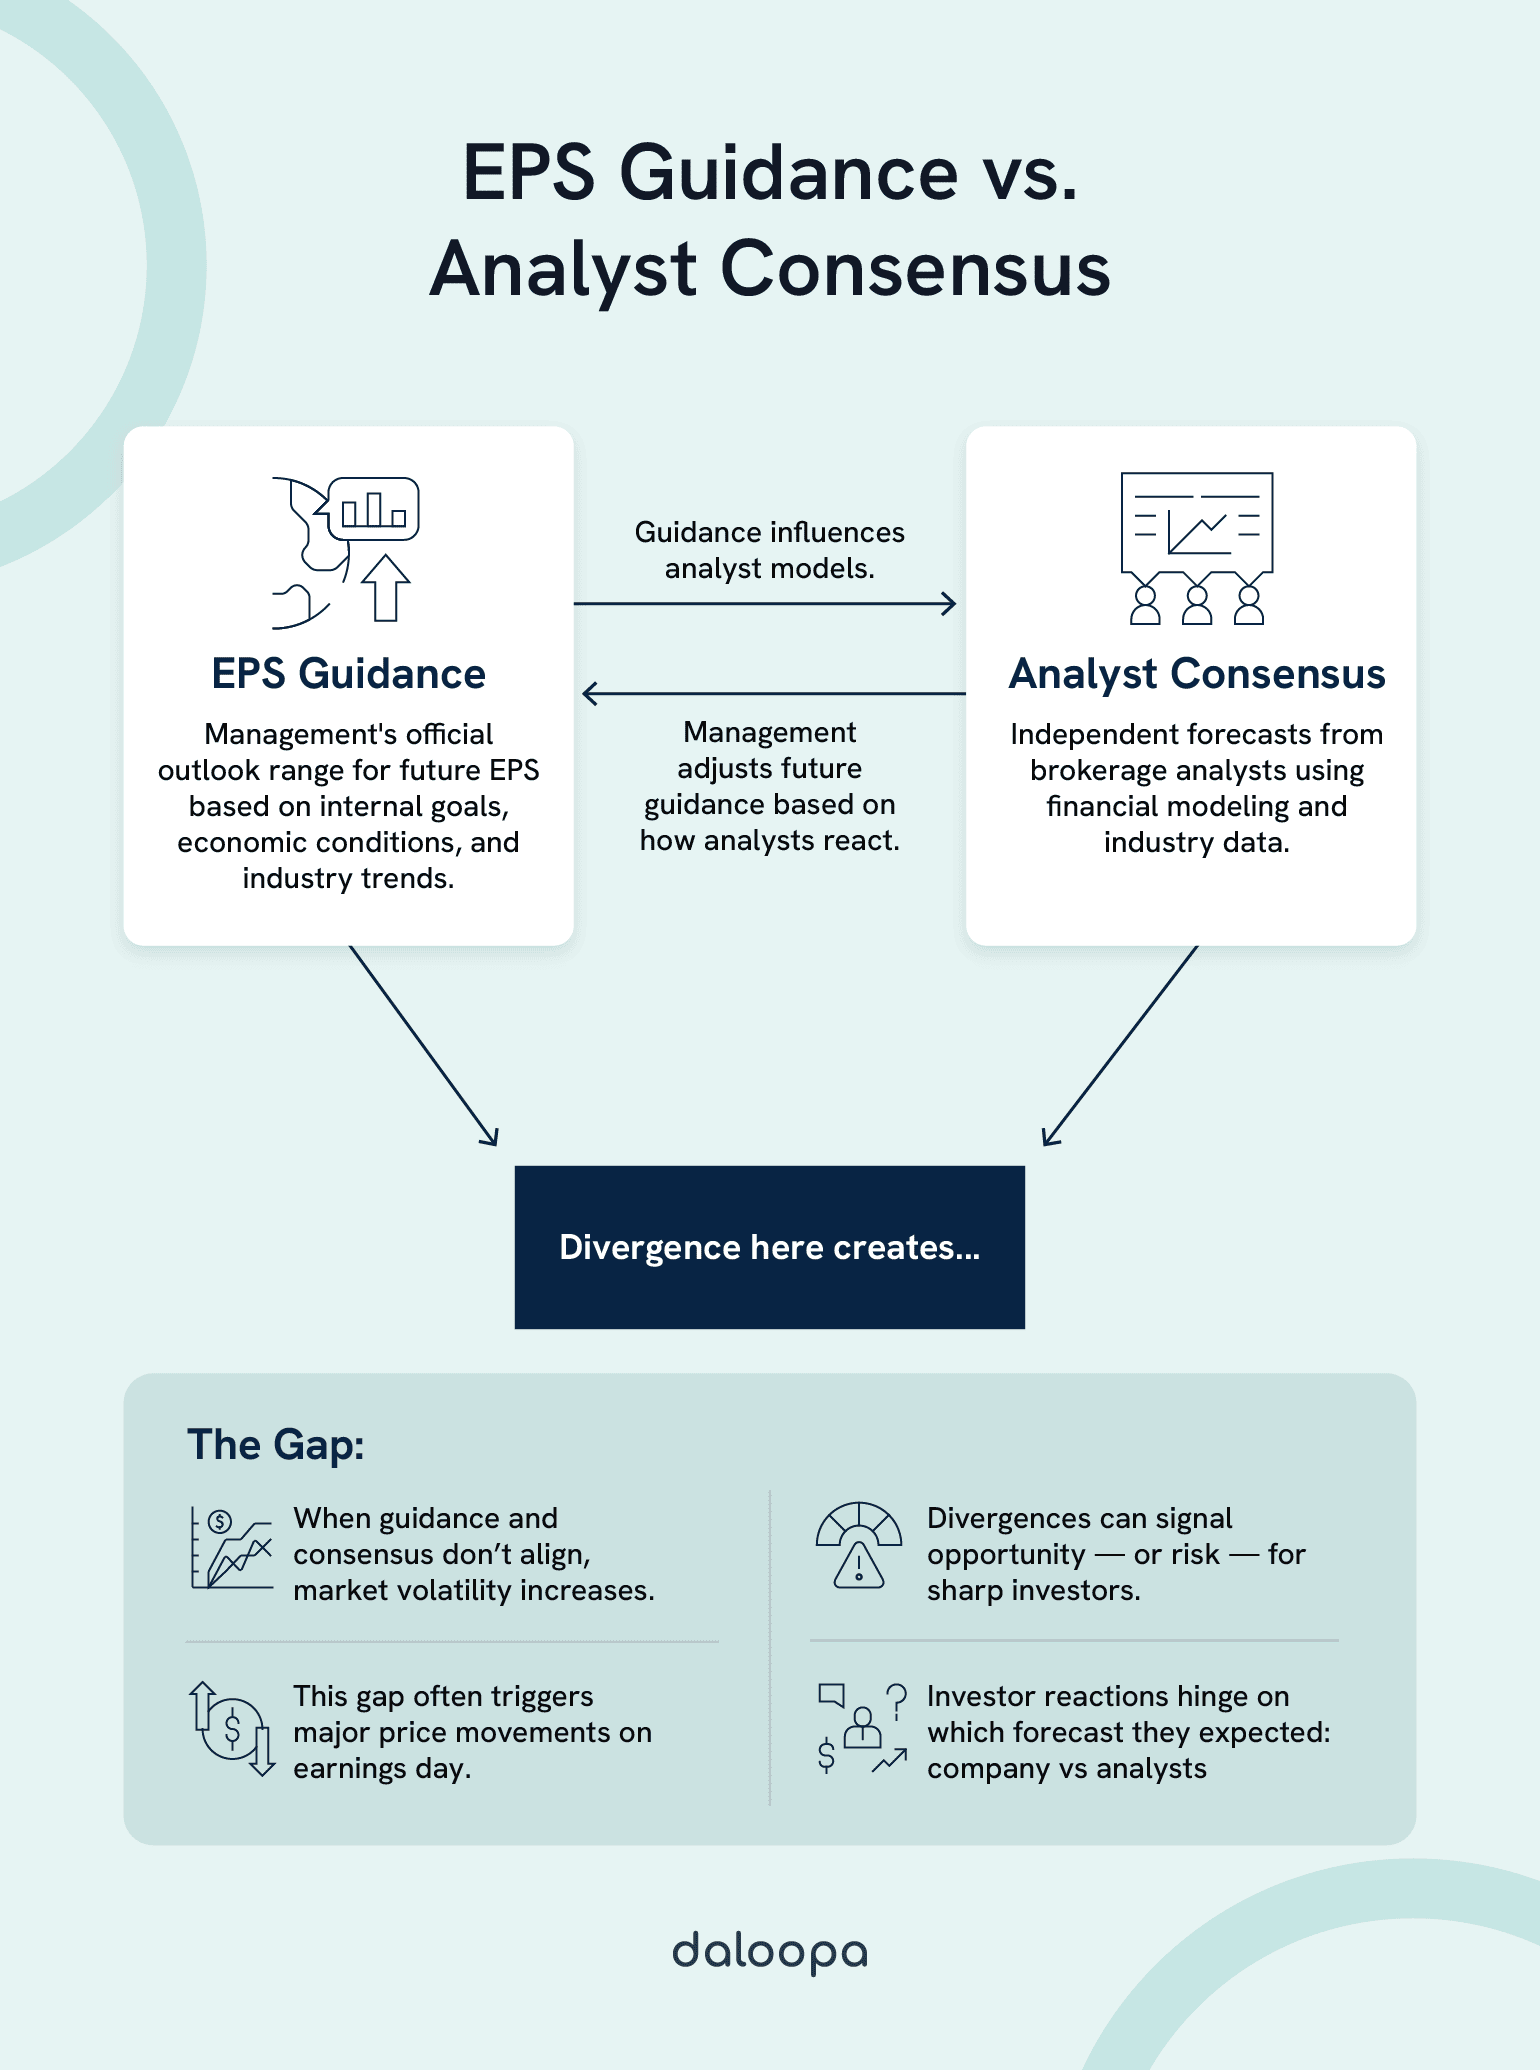
The Dynamics Between EPS Guidance and Analyst Consensus
EPS guidance and analyst consensus form an ongoing dialogue that you can tap into for trade signals and risk management. By connecting management’s forward-looking comments with independent forecasts, you’ll decode market sentiment ahead of release days.
The Fundamentals of EPS Metrics
EPS (earnings per share) tells you how much profit a company makes for each share of its stock. You calculate EPS by taking net income minus preferred dividends and dividing by the weighted-average shares outstanding. EPS is reported quarterly (and annually) under GAAP rules, and companies often also report an adjusted EPS that strips out one-time items. Rising EPS generally means the business is executing well.
In your models, EPS directly drives valuation: it’s the “E” in P/E. For example, if two firms have the same stock price but one has higher EPS, that company looks cheaper. Because EPS is so closely tied to shareholder returns (through dividends or share buybacks), it anchors many investment decisions.
Company-Issued EPS Guidance
Management’s guidance is essentially their official outlook range for future EPS (or revenue, margins, etc.). Companies usually give a range (for example, “$2.50–$2.70 per share”), not a point number, to allow some wiggle room. The level of guidance reflects what management expects, based on factors like current economic conditions, industry trends, and internal goals. For instance, if the economy is weakening, management may project slower sales, or if they’re planning a big product launch, they may forecast a bump.
Companies also tailor guidance philosophy to their style and sector. Mature firms with stable businesses often guide more tightly, while cyclical or high-growth firms may use very conservative guidance. You’ll find that many managers prefer to “low-ball” the numbers (set guidance below what they think they’ll hit) so they can beat expectations later. That way the market cheers a surprise, and the stock can rally.
Some firms issue only annual EPS guidance, while others break it down quarterly, allowing more precise earnings forecasting and giving analysts a clearer modeling horizon.
Analyst Consensus Formation and Financial Modeling
Analysts generate EPS estimates through financial modeling for earnings that blend guidance, industry data, and macro assumptions. When brokerage houses publish their forecasts—say, your bank’s research teams at JPMorgan, Morgan Stanley, and UBS—you see the consensus emerge. 88% of these forecasts land within ±$0.04 of actuals, underscoring how closely they hew to guidance.
You monitor:
- Revision velocity: How fast estimates shift after new information.
- Dispersion: The gap between high and low estimates—wider spreads often signal debate and potential volatility.
Together, these metrics give you an early read on sentiment shifts that precede official earnings.
The Gap Analysis: Guidance vs. Consensus
When management guidance diverges from analyst consensus, it creates a fault line you can exploit. That tension often drives the biggest price reactions on earnings day. This kind of divergence is where precise earnings forecasting becomes a competitive edge.
Market Reactions and Price Movements
When earnings hit, investors immediately compare results to the forecast they believe. It’s not just the EPS number that matters but which forecast it beats or misses. You’ve likely seen stocks drop on what looked like a “good” quarter simply because guidance was weaker than expected.
A classic example: Snap’s Q2 report. The company’s actual EPS was close to estimates, but guidance on revenue was cut materially. Markets punished Snap hard – the stock fell roughly 25% in after-hours trading.
Management Strategy and Guidance Philosophy
Companies manage expectations as much as they manage operations. Some CEOs deliberately set conservative guidance (a strategy known as “low-balling”) so they can beat it later and claim victory. Others in high-volatility sectors will use wide ranges or vague language to preserve flexibility.
Key factors shaping a company’s guidance approach include how predictable the business is, competitive pressures, and past credibility. If a CEO has previously missed guidance significantly, analysts may discount future guidance or focus more on their own models. High input-cost volatility (like fuel prices for an airline) typically leads management to be more cautious in guidance language. Conversely, if a company always blows past guidance, investors might start to view guidance as just a safe floor rather than a real target. In short, map each company’s guidance style to its context – it will tell you how much weight to put on the numbers versus management’s words.
Analyst Behavior and Incentives
Remember, analysts are people with jobs and reputations. They communicate with company executives, compete for clients, and often worry about career risk. All of these incentives shape consensus. For one, analysts tend to exhibit a mild optimism bias. They may avoid predicting a miss unless they have very strong evidence, because being too bearish risks alienating company management or losing credibility if they’re wrong. Likewise, they may flock to the average estimate (herd) rather than stray too far from their peers. Behavioral research finds that when analysts are stressed or overworked, they often resort to “self-herding” (reissuing their previous estimate) or simply rounding to consensus.
Beyond EPS: Complementary Metrics
EPS alone can mislead. You’ll layer in metrics that reveal sustainability and quality:
- Free Cash Flow (FCF): A company reporting EPS of $1.20 but FCF margin slipping from 20% to 12% signals rising working capital or capex pressures.
- Operating Leverage: Track SG&A expense trends—rising overhead can erode EPS gains.
- ROIC: A falling ROIC despite EPS growth warns of diminishing returns on investment.
These complementary metrics, when layered into financial modeling for earnings, can reveal when headline EPS is masking structural weakness.
Investor Strategies for Navigating Guidance and Consensus
Savvy investors use both sides of the forecast equation in their playbook. Instead of waiting for the earnings shock, build your own view of where guidance and consensus are trending. A practical approach is to keep a simple tracker (a spreadsheet or dashboard) that records each quarter’s guidance range, the current consensus estimate, and recent beat/miss history. Check this tracker regularly – consensus often drifts after guidance is issued or new information leaks out. Note the direction of estimate revisions: if analysts keep pushing earnings forecasts down, perhaps management is becoming pessimistic.
Monitor key upcoming events for guidance updates: earnings calls, investor days, Form 8-K filings, and even major conferences. When a company revises guidance mid-quarter, that’s a clear signal to update your models. Also, pay attention to the language: vague or qualified forecasts (“assuming favorable FX, pending approvals, etc”) can be as telling as the numbers.
Do a quarterly review after each earnings release: ask whether management hit its own guidance for revenue and margins. If they miss internally, you’ll want to know why before trusting the next guidance. Also, check whether analysts promptly revised estimates to match the new reality. Finally, watch the dispersion of estimates: a wide range between the highest and lowest forecasts signals disagreement. That disagreement can mean risk, but also potential upside if you side with the right analyst.
Regulatory Considerations and Disclosure Evolution
The rules around guidance and forecasts changed radically with Regulation Fair Disclosure (Reg FD) in 2000. Before Reg FD, companies could tell a few analysts material outlook information in private meetings; now they must broadcast it to everyone at once. As the SEC put it, Reg FD is designed to “foster fairer disclosure of information to all investors”.
Under Reg FD, companies have gotten into the habit of using formal channels for forecasts. Today you’ll find most EPS guidance in the slides or script of an earnings call, or as a numbered range in a 8-K filing. This transparency helps analysts sync their financial modeling for earnings with what management is actually signaling.
Most forward-looking statements carry footnoted assumptions and risk disclosures – something you can thank Reg FD for. This structured transparency has a plus: each piece of guidance is now auditable.
Ready to trade on those insights?
Daloopa’s platform bundles historical guidance, actuals, and analyst estimates in one place. You can click any EPS or revenue figure and instantly pull up the exact 10‑Q page or call slide it came from – full audit trail, no digging. With a free Daloopa account, you can even download sample models to see this in action. Armed with clean, up-to-the-minute data, your focus shifts from filling spreadsheets to using financial modeling for earnings as a tool for insight, not just compliance. Dive in and discover how much smoother earnings forecasting can be when you let technology handle the details.


