Financial data visualization bridges complex information with clear, actionable insights. However, creating impactful visualizations demands access to the best finance datasets for visualization. Comprehensive and reliable financial datasets help analysts find patterns, identify opportunities, and communicate findings effectively.
Have you ever struggled to make sense of vast financial data or extract actionable insights? The right datasets turn raw information into visually compelling, decision-driving narratives.
Key Takeaways
- High-quality finance datasets are the backbone of impactful visualizations.
- The ideal datasets excel in accuracy, timeliness, and breadth.
- Thoughtfully chosen sources enhance the analytical depth and communicative power of financial visualizations.
The Importance of Quality Finance Datasets for Analysis
Robust data not only identifies trends but also helps analysts translate complexity into actionable insights.
For instance, economic inequality datasets help quantify disparities, supporting discussions on wealth distribution and policy implications. In corporate finance, quality finance datasets for analysis provide key inputs for evaluating market opportunities, tracking competitors, and identifying trends.
Hypothetical Example
A financial analyst used data from the U.S. Federal Reserve Economic Data (FRED) to assess historical interest rate changes. You can develop a visualization predicting market corrections, aiding clients in real estate investment decisions.
High-quality finance datasets for analysis streamline workflows by reducing the need for data cleaning and preprocessing. Reliable data ensures transparency, credibility, and the ability to withstand scrutiny from stakeholders.
Criteria for Selecting the Best Finance Datasets for Visualization
To enhance your visualization and analytics work, consider these key selection criteria for finding quality finance datasets for analysis.
Reliability and Trustworthiness
Trustworthy datasets stem from reputable entities like government agencies, established institutions, or well-known research organizations. These sources implement stringent validation and collection methods, ensuring reliability.
Evaluating Source Reputation
Sources such as central banks, stock exchanges, or leading research institutions often follow rigorous processes for data validation and cleaning. For instance, data from the U.S. Federal Reserve (FRED) undergoes multiple checks to ensure accuracy before publication.
Detailed documentation enhances understanding of data methodology, while regular updates signify ongoing quality assurance. Cross-referencing data and ensuring comprehensive coverage further solidifies a dataset’s dependability.
Versatility and Applicability
Finance datasets excel when they support diverse analytical needs, from time series modeling to machine learning applications. Granularity plays a significant role; reliable financial datasets offering both high-level summaries and detailed insights allow users to navigate between macro and micro analyses.
Additionally, datasets should cover varied indicators, like market segments or timeframes, and be compatible with standard formats such as CSV or JSON, simplifying integration into existing workflows.
Accessibility and Open Access
Open-access datasets democratize data usage, encouraging collaboration and reproducibility. Ideal datasets come with accessible APIs, allowing seamless data retrieval. Real-time updates are invaluable for time-sensitive financial analyses.
Accessible Data for Real-world Applications
Platforms offering user-friendly interfaces for data exploration ensure smoother workflows. For example, open platforms like Kaggle provide reliable financial datasets in easy-to-download formats that require minimal setup time. Similarly, APIs such as Alpha Vantage or Quandl provide options for real-time retrieval of stock and forex data, perfect for live analysis and trading models.
Consistency in data formatting and adherence to standard schemas make processing and analysis more efficient. Adopting standards reduces workflow friction, ensuring that datasets integrate seamlessly into financial visualization and analysis pipelines.
The accessibility of these datasets also opens the door for smaller organizations or independent analysts who may not have access to costly premium data subscriptions. This levels the playing field, fostering innovation and enabling broader participation in financial analysis projects.

The Best Finance Datasets for Visualization
Comprehensive financial datasets pave the way for impactful visualizations. Below are some of the most reliable sources, spanning global databases, niche platforms, and specialized indicators.
1. Daloopa’s Intelligent Financial Datasets
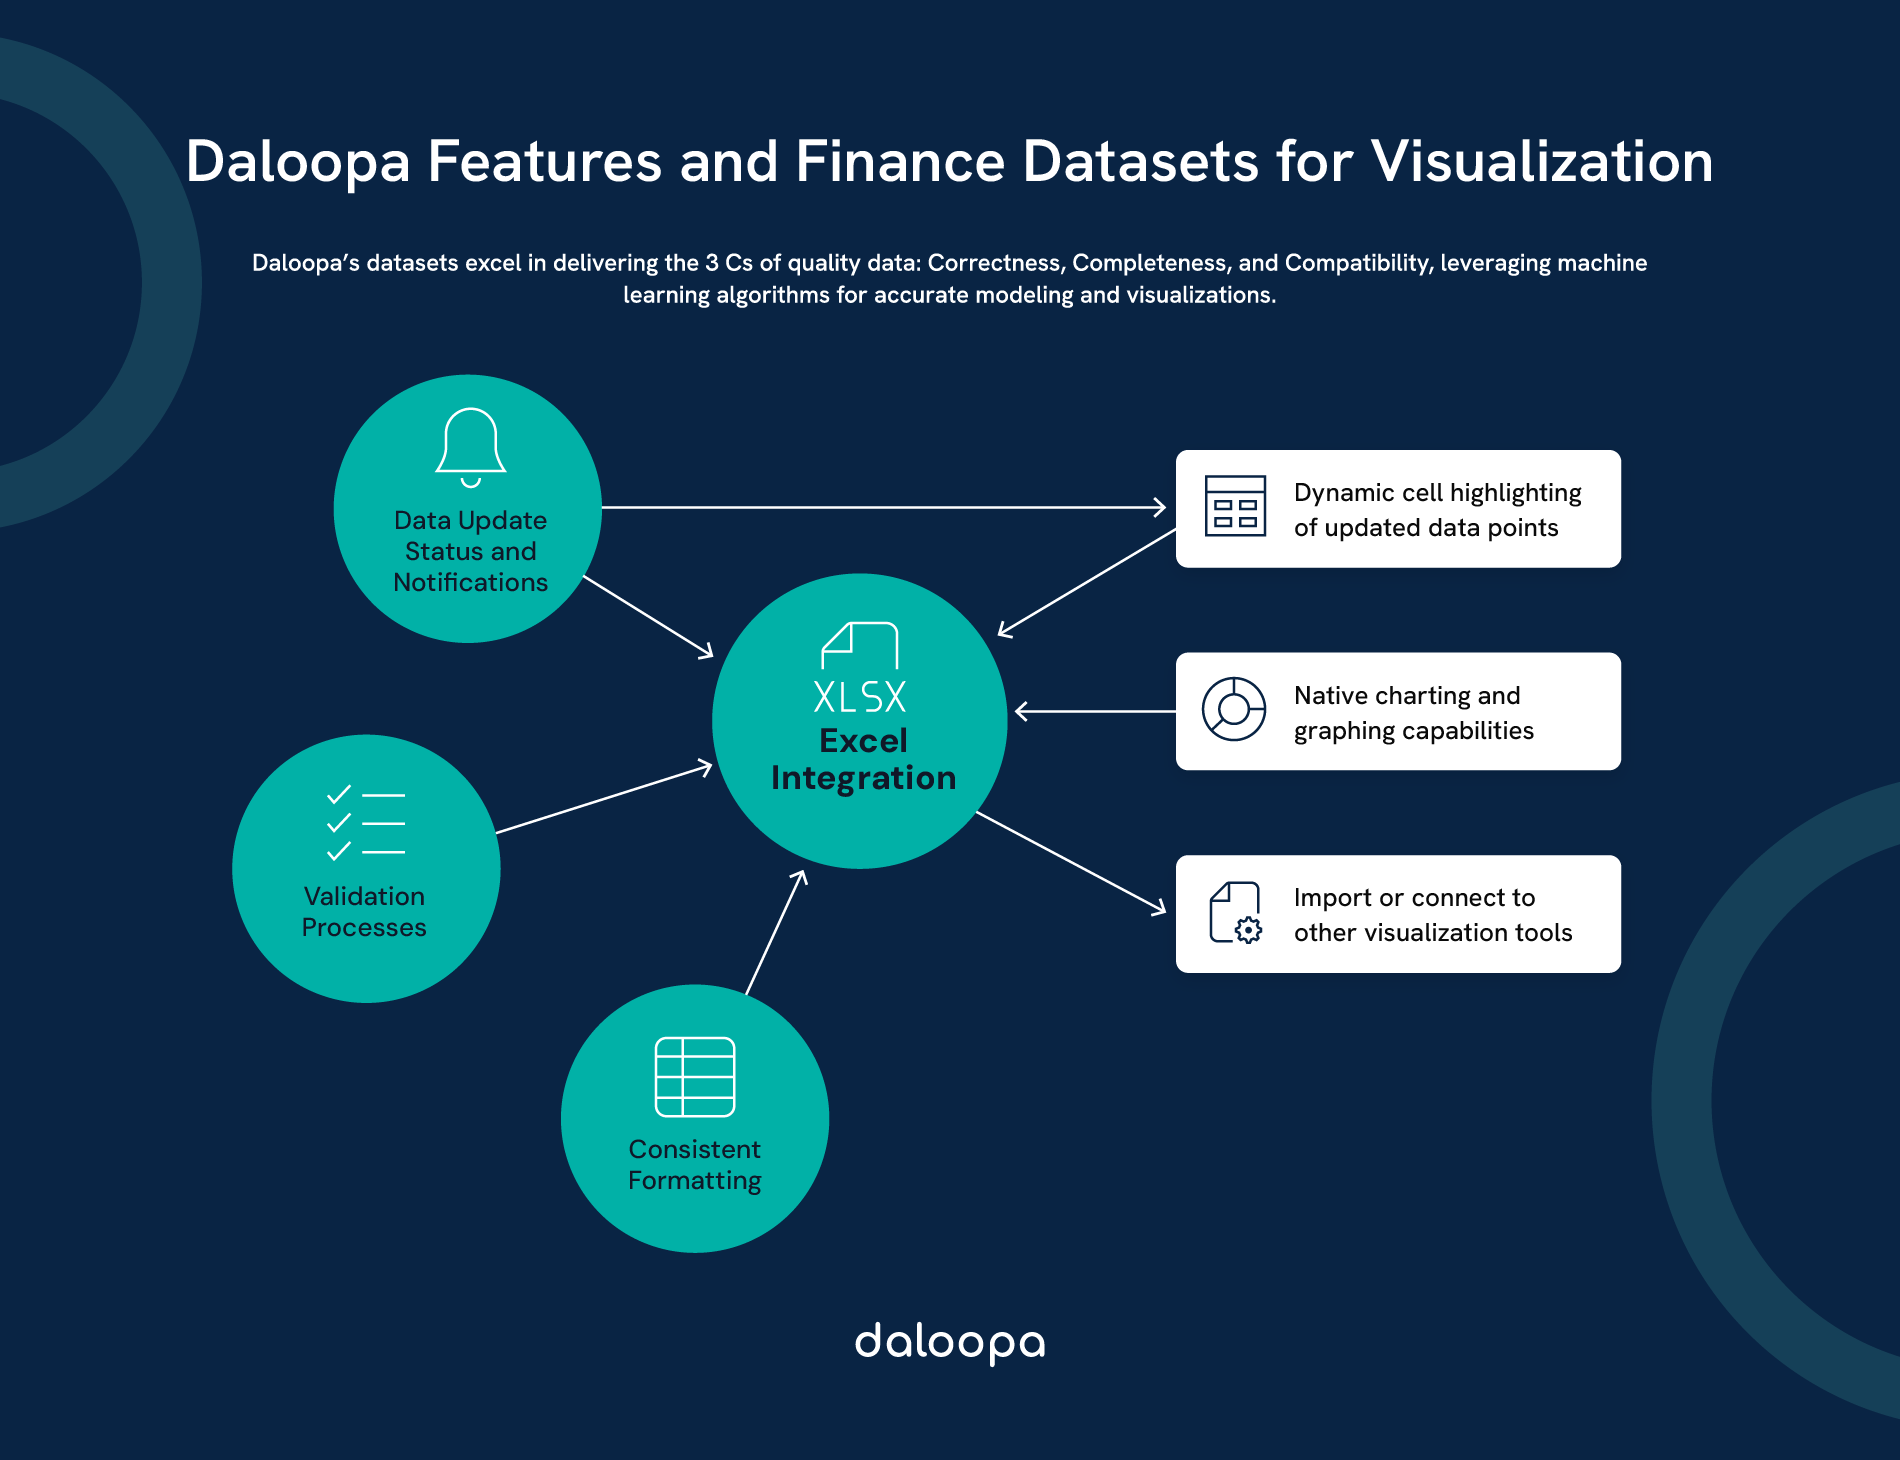
Daloopa sets itself apart by delivering the 3 Cs of quality data: Correctness, Completeness, and Compatibility. Its datasets leverage advanced machine learning algorithms to ensure unparalleled accuracy and functionality for financial modeling and visualizations.
Key Features of Daloopa’s Datasets
- Data Update Status and Notifications: Stay informed with real-time updates and notifications, ensuring you’re always working with the most current information.
- Validation Processes: Rigorous data validation minimizes errors, providing confidence in your analysis.
- Consistent Formatting: Uniform structures simplify integration into workflows, making it easy to scale analysis.
- Excel Integration: Seamlessly integrate datasets into Excel with dynamic features such as:
- Cell highlighting to mark updated data points.
- Native charting and graphing capabilities for instant visualizations.
- Compatibility with Visualization Tools: Easily import data into popular visualization platforms like Tableau or Power BI for advanced analysis and storytelling.
2. World Bank Open Data and IMF Data Portals
The World Bank Open Data and IMF Data portals provide extensive datasets, from GDP figures to inflation rates and trade statistics. While the World Bank excels in historical trends, the IMF focuses on current economic data.
These datasets allow for the exploration of various economic phenomena, such as understanding how GDP fluctuations influence trade dynamics or evaluating how inflation correlates with consumer purchasing behavior across different countries.
3. OECD Public Finance Dataset
For fiscal analysis, the OECD Public Finance Dataset offers granular details on government revenue and debt for member nations. It is ideal for investigating how policies impact taxation and expenditure trends.
4. Federal Reserve Economic Data (FRED)
In the U.S., FRED (Federal Reserve Economic Data) is a go-to resource for economic time series. FRED compiles data from reputable sources, including U.S. Census reports, Bureau of Labor Statistics figures, and more.
5. Kaggle
Platforms like Kaggle host community-driven datasets ranging from cryptocurrency to consumer finance, often paired with high-quality documentation. Kaggle also fosters a competitive environment, resulting in well-curated data projects and new approaches to financial problem-solving.
6. Quandl and Alpha Vantage API
Quandl (a Nasdaq company) and Alpha Vantage API offer robust financial datasets. While Quandl provides both free and premium macroeconomic data, Alpha Vantage specializes in real-time stock and forex data for algorithmic trading.
These platforms often include forums and community insights, where users can exchange tips, collaborate on projects, and learn from one another, making them ideal for both beginners and advanced analysts.
7. Bank for International Settlements (BIS)
The Bank for International Settlements (BIS) provides insights into global financial flows and systemic risks.
8. SEC EDGAR
For corporate analysis, SEC EDGAR offers detailed filings. Financial professionals can conduct deep-dive analyses into company earnings, investment strategies, and compliance measures with this resource.
9. World Inequality Database and Eurostat
The World Inequality Database and Eurostat datasets focus on income disparity and EU-specific metrics, supporting discussions on wealth distribution and regional economic performance.
Utilizing Finance Datasets for Effective Visualization
Harnessing finance datasets effectively transforms data into narratives and insights that inform decisions and foster understanding.
Data Science and Machine Learning Projects
Finance datasets are foundational for advanced machine learning applications. Stock market data enables predictive modeling for trading strategies, while historical data supports fraud detection systems. Large transaction datasets can train sentiment analysis models to interpret market behavior.
Building Advanced Models
Time-series data allows precise trend forecasting while combining datasets from various sources can add depth and context to analyses. For instance, blending transaction data with economic indicators can enhance fraud detection algorithms’ performance, providing real-time insights.
Leveraging Granularity
Granular datasets enable researchers to zoom in on micro-level details like individual transaction trends while considering the macroeconomic environment. This dual capability makes these datasets highly versatile for academic and business use.
Data Storytelling and Policy Analysis
Visualizations can simplify complex economic phenomena, fostering informed policymaking.
Interactive and Accessible Visualizations
With reliable finance datasets, visualizations can simplify complex economic phenomena. For instance, interactive graphs make trends like inflation or employment comprehensible to policymakers.
Supporting Policy Development
Using visual tools, analysts can showcase the broader impact of policy decisions on financial markets or household incomes, helping to create a shared understanding among stakeholders and paves the way for more evidence-based policymaking.
Tips for Analysts
- Combine reliable financial datasets from different sources to uncover relationships, such as how environmental factors influence economic performance.
- Use interactive graphs and dashboards to make insights more accessible to non-technical stakeholders.
Maximizing Impact with the Right Data
Comprehensive, high-quality finance datasets for analysis amplify its impact. Integrating data from diverse domains enables analysts to uncover hidden insights, craft compelling narratives, and drive actionable results.
Empowering Financial Professionals with Comprehensive Data
The best finance datasets for visualization support tasks from risk assessment to investment strategy. For instance, combining BIS data on global risks with market trends can help financial professionals anticipate downturns and adjust portfolios effectively.
Transform Your Investment Strategies with Daloopa
Daloopa’s AI-powered financial modeling platform integrates accurate, up-to-date data into your workflow, saving time and enhancing the quality of your analysis. Automate routine tasks and focus on uncovering insights that matter.
Request a demo today to experience how Daloopa can revolutionize your financial visualizations.


