
Anyone involved in business planning, investment analysis, and decision-making requires essential Excel financial modeling and forecasting tools. Adhering to best practices, such as clear distinctions between inputs and calculations, logical data structuring, and regular updates, ensures accuracy and reliability. A strong foundation in financial modeling principles and effective use of Excel’s features allows for creating transparent, adaptable models that are easy to update and analyze. Incorporating accurate forecasting techniques, like using historical data and scenario analysis, enhances the relevance of these models, ensuring they stay aligned with the latest information.
Key takeaways
- Best practices in Excel ensure model accuracy and reliability.
- Fundamental principles include straightforward design and logical structure.
- Continuous updates keep financial models relevant and current.
Building a solid foundation
Establishing a strong base for financial modeling and forecasting in Excel involves understanding the model’s purpose, key assumptions, data organization, proper formatting, and creating an informative cover page.
Understanding the purpose and objectives of the financial model
Before diving into the technical aspects, we need to clarify the purpose and objectives of our financial model to guide our modeling process and ensure our efforts align with the end goals.
Determine if your goal involves budgeting, forecasting, evaluating investment scenarios, or some other financial goal. Defining clear objectives helps us make informed decisions throughout the model development phase.
Organizing data and using proper data validation techniques
Organized data functions as the backbone of a solid financial model. We must categorize and structure our data efficiently, making it easy to reference and update. Using Excel’s data validation techniques maintains data integrity, minimizes errors, and ensures that the data feeding into our models is accurate and reliable.
We can use Excel to validate any historical data with audited financial statements or any other available credible records. Make sure to validate your historical information further through expert opinion and analysis.
Identifying the key assumptions and inputs
Now that we have collected the necessary assumption and input data, identifying the key assumptions and inputs becomes much easier. Consider common fundamental assumptions like historical data, projected growth rates, cost estimates, and macroeconomic factors.
By clearly identifying and documenting these assumptions, we lay a transparent foundation for our model.
Creating a blueprint to provide an overview of the model
A good blueprint provides a summary that includes the key aspects of the chosen financial model, including inputs, calculations, and outputs. The blueprint acts as a roadmap, guiding our Excel tool use and highlighting the most critical elements that need executing.
We use the blueprint in combination with key assumptions and inputs to confirm the target audience and ensure the completed model will function as needed.
Designing the model
When designing an effective financial model in Excel, we must consider the structure, formula usage, data retrieval methods, conditional formatting, and error checks. A well-thought-out model ensures accuracy and usability while making data analysis and forecasting straightforward.
Choosing the appropriate model structure and layout
We should aim for a logical, clear structure with an easily navigated layout. Your model’s input, calculation, and output sections should be distinctly separated.
Use tables for structured data and charts for visual summaries. A consistent color scheme and labeled sections help users understand the flow and purpose of each part of the model. For example, label the inputs in black, outputs in blue, and calculations in red. Provide a color key on the first sheet to provide context to new users.
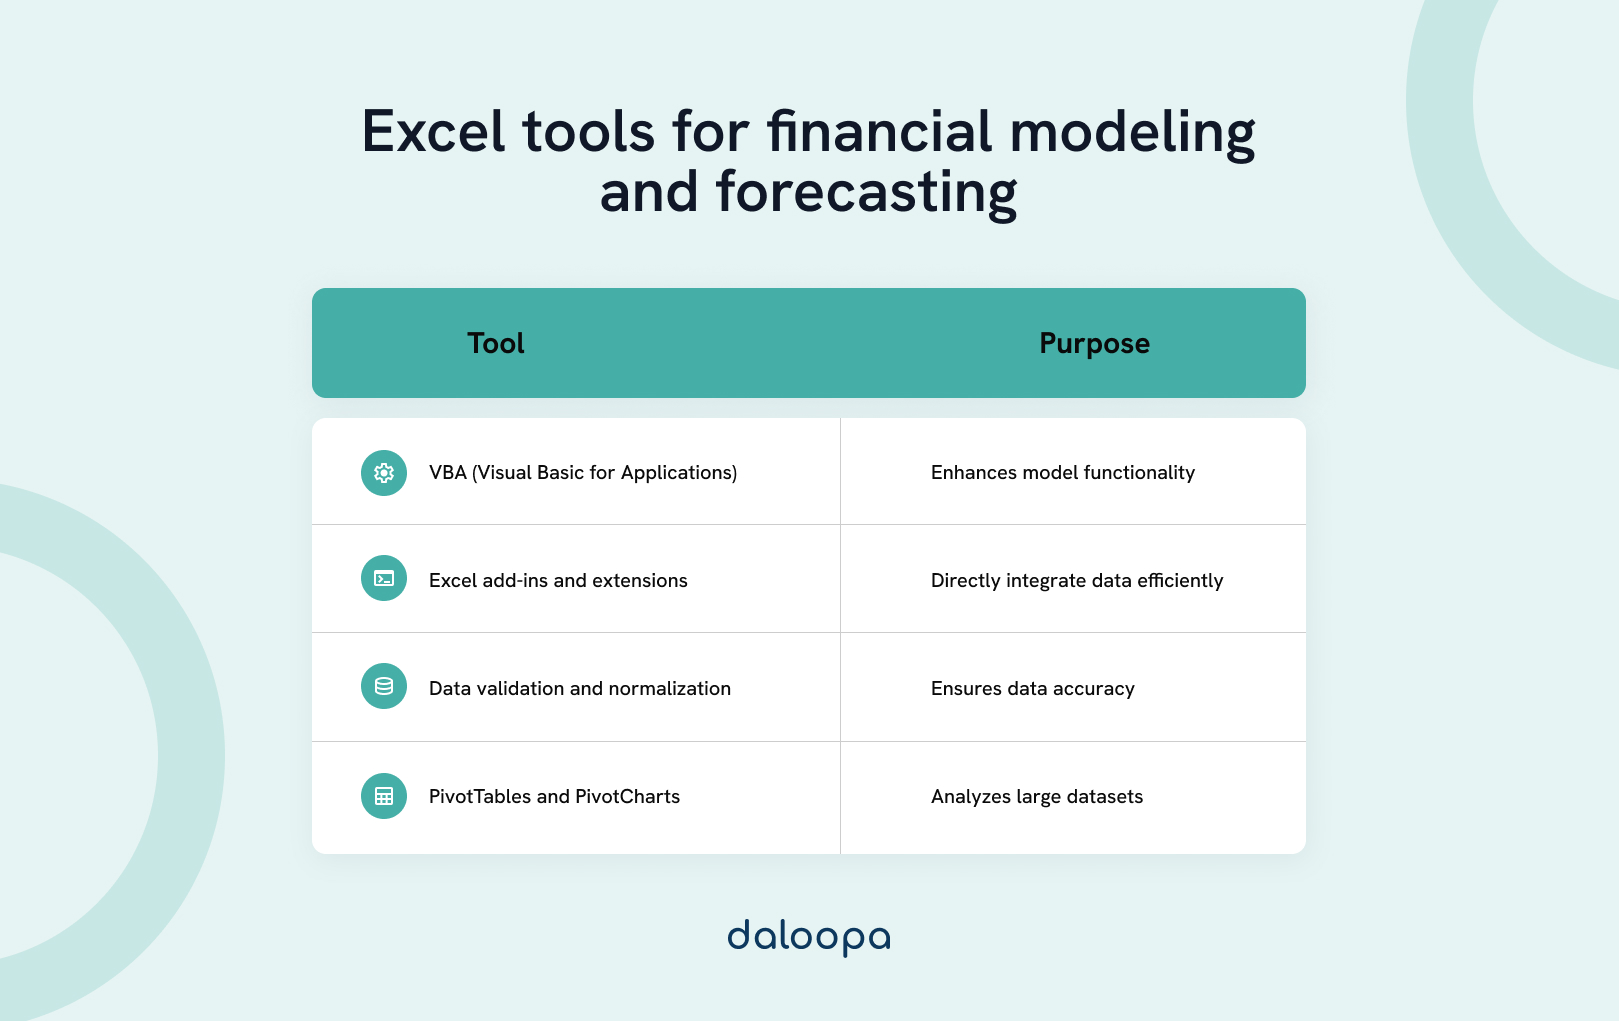
Using formulas and functions effectively
Using formulas and functions effectively in financial modeling and forecasting in Excel significantly reduces the risk of errors. Use nested functions for complex calculations rather than manually inputting them. We can reuse the nested function for further calculations rather than needing to start again.
Utilizing INDEX MATCH for efficient data retrieval
INDEX MATCH functions as a powerful alternative to VLOOKUP for efficient data retrieval. VLOOKUP or vertical lookup only allows us to search for a value in the first column of a sheet and then return a value in that same column.
INDEX MATCH combines two functions that provide us with more flexibility. INDEX allows us to access the value of a cell within a defined range in whatever row and column we choose. MATCH locates the position of a value in the specified range, allowing us to search horizontally and vertically without the limitations placed by VLOOKUP’s fixed column index.
Applying error checks and validation rules
Use ISERROR, IFERROR, and ISNUMBER functions to identify and handle potential errors within formulas. Data validation rules restrict the type of data entered into cells, ensuring consistency and preventing input errors. Additionally, adding summary sheets helps us quickly review runtime errors and discrepancies, reinforcing the model’s reliability.
- ISERROR(value) – Displays TRUE if the value results in an error.
- IFERROR(value, value_if_error) – Allows you to customize the response if the result returns an error.
- ISNUMBER(value) – Returns TRUE if the value contains a number and FALSE if it doesn’t
Financial statements and analysis
We must focus on several key practices to create financial statements and analyze the provided data.
Building accurate income statements and balance sheets
Building accurate income statements requires careful recording of revenue, cost of goods sold, and operating expenses. We must ensure that all income and expenses are correctly categorized to reflect the company’s profitability accurately.
Balance sheets, on the other hand, detail a company’s financial position. Assets, liabilities, and shareholders’ equity must be documented with precision. Matching the company’s assets with its liabilities plus equity helps maintain balance sheet integrity.
Analyzing financial performance using key ratios and metrics
Key ratios and metrics assist in analyzing financial performance.
- Liquidity ratios such as the current ratio and quick ratio help assess short-term financial stability.
- Profitability ratios like return on assets (ROA) and return on equity (ROE) reflect the company’s efficiency in generating profit.
- Debt ratios indicate leverage and financial risk.
- Efficiency ratios measure how effectively the company uses its assets.
Performing sensitivity analysis to assess the impact of changes
Sensitivity analysis helps us understand how changes in assumptions affect financial outcomes. We can see potential profitability and cash flow impacts by altering variables such as sales growth rates and cost estimates.
A sensitivity analysis highlights vulnerabilities and areas of risk, ensuring preparation for different scenarios. Excel tools such as data tables and scenario managers help us perform sensitivity analyses effectively.
Forecasting and decision-making
Accurate forecasting and informed decision-making take a large role in financial modeling.
Developing reliable cash flow forecasts
Developing reliable cash flow forecasts begins with gathering accurate historical data. Analyzing past cash flows allows us to detect trends and anomalies.
Using Excel’s forecasting tools, we project future revenues and expenses by incorporating variables like seasonality, market conditions, and industry trends. We need to validate our forecasts periodically to ensure accuracy and relevancy.
Regularly updating cash flow forecasts improves reliability, helping us make informed financial decisions and allocate resources effectively.
Considering long-term trends and market conditions
We adjust forecasts to reflect potential economic shifts by studying macroeconomic indicators such as GDP growth rates, interest rates, and inflation.
We also examine industry-specific trends, competition, and technological advancements. Integrating these factors into our forecasts helps anticipate changes and mitigate risks.
Granular analysis of market data ensures our financial models remain relevant and forward-looking, positioning us to make strategic decisions.
Using scenario analysis to evaluate different outcomes
Scenario analysis allows us to explore various potential outcomes by altering key assumptions. By creating best-case, worst-case, and base-case scenarios, we assess the impact of different variables on our financial projections.
We already discussed the value of Excel’s data tables and scenario manager when preparing our blueprint. The same applies to preparing forecasts. Comparing scenarios helps us understand potential risks and benefits, guiding strategic decisions and predicting future cash flow.
The process aids in stress-testing our models, ensuring full preparation for diverse future conditions.
Applying best practices for investment banking models
Investment banking models require meticulous attention to detail and adherence to standard practices. Building these models involves assembling comprehensive financial statements, performing valuation analysis, and incorporating sensitivity tests.
We ensure clarity and consistency by using standardized templates and naming conventions. Regularly auditing formulas and cross-referencing data ensures accuracy.
Additionally, integrating advanced techniques like Monte Carlo simulations enhances the model’s robustness, supporting high-stakes financial decisions.
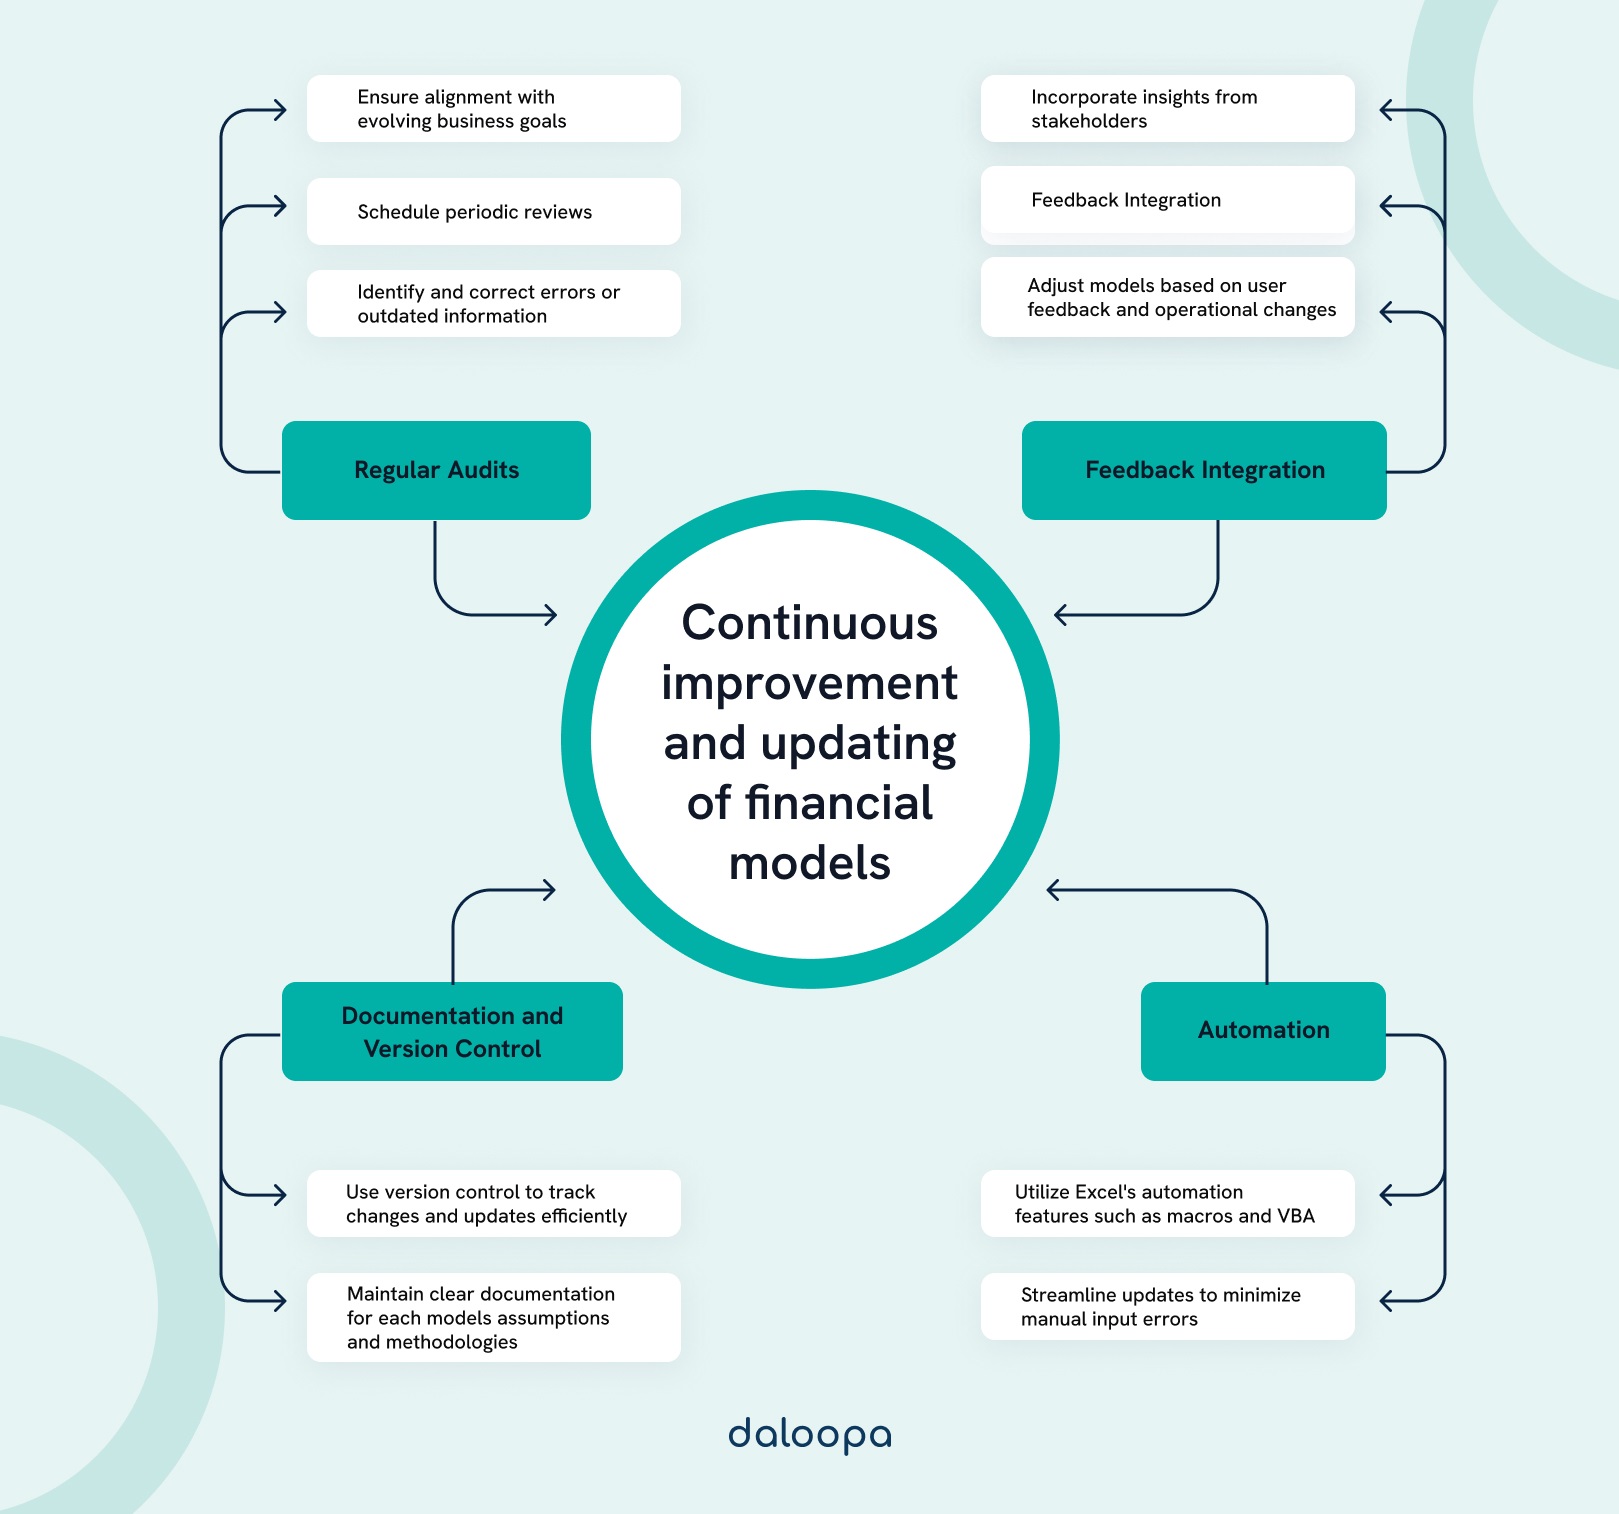
Continuous improvement and updating of models
Some key steps to continuous improvement and updating of models include scheduling regular audits to review and correct errors, integrating feedback from stakeholders, and aligning models with evolving business goals. Utilizing Excel’s automation features, such as macros and VBA, helps streamline updates and minimize manual errors. Clear documentation of assumptions and methodologies and efficient version control ensure transparent tracking of changes.
Using the financial model as a tool for decision-making
Financial models serve as vital tools for evaluating business decisions. By inputting different variables, we can predict outcomes and make data-driven choices.
Key performance indicators (KPIs) derived from our models provide insights into profitability, liquidity, and growth. Monitoring these KPIs ensures alignment with business goals.
Regularly refining our models enhances their predictive power, guiding us in making strategic, informed decisions across various business operations.
Unlock Your Financial Modeling Potential with Daloopa!
Ready to take your financial modeling and forecasting to the next level? With our cutting-edge tools, you can streamline your data processes, ensure accuracy, and create models that are both powerful and easy to update. Whether you’re a seasoned analyst or just starting, Daloopa’s platform makes it simple to manage complex data and generate reliable forecasts. Don’t let outdated methods slow you down—create a free account to experience Daloopa and start your journey toward smarter, more efficient financial modeling.


