
In today’s data-driven financial landscape, the ability to efficiently collect, integrate, and analyze vast amounts of information is crucial for financial analysts. While Excel remains a cornerstone tool in finance, its native capabilities can be significantly enhanced through the use of specialized add-ins. These powerful extensions transform Excel into a more robust platform for data management and analysis, enabling financial analysts to work smarter, faster, and with greater accuracy.
These tools focus on gathering and integrating data from various sources into Excel, ensuring a unified dataset for analysis. While most of the data provided by these tools is publicly available, a few of these aggregate data that’s proprietary or hard to access, and crucially save thousands of hours a year searching through random PDFs & CSVs.
- SQL Spreads: Integrates Excel with SQL databases for seamless data management.
- Functionality: Integrates Excel with SQL databases for seamless data management.
- Benefits: Allows users to read and write data between Excel and SQL databases, simplifying data updates and analysis.
- Example Use: Updating financial data in SQL databases directly from Excel spreadsheets, ensuring data consistency and reducing manual entry errors.
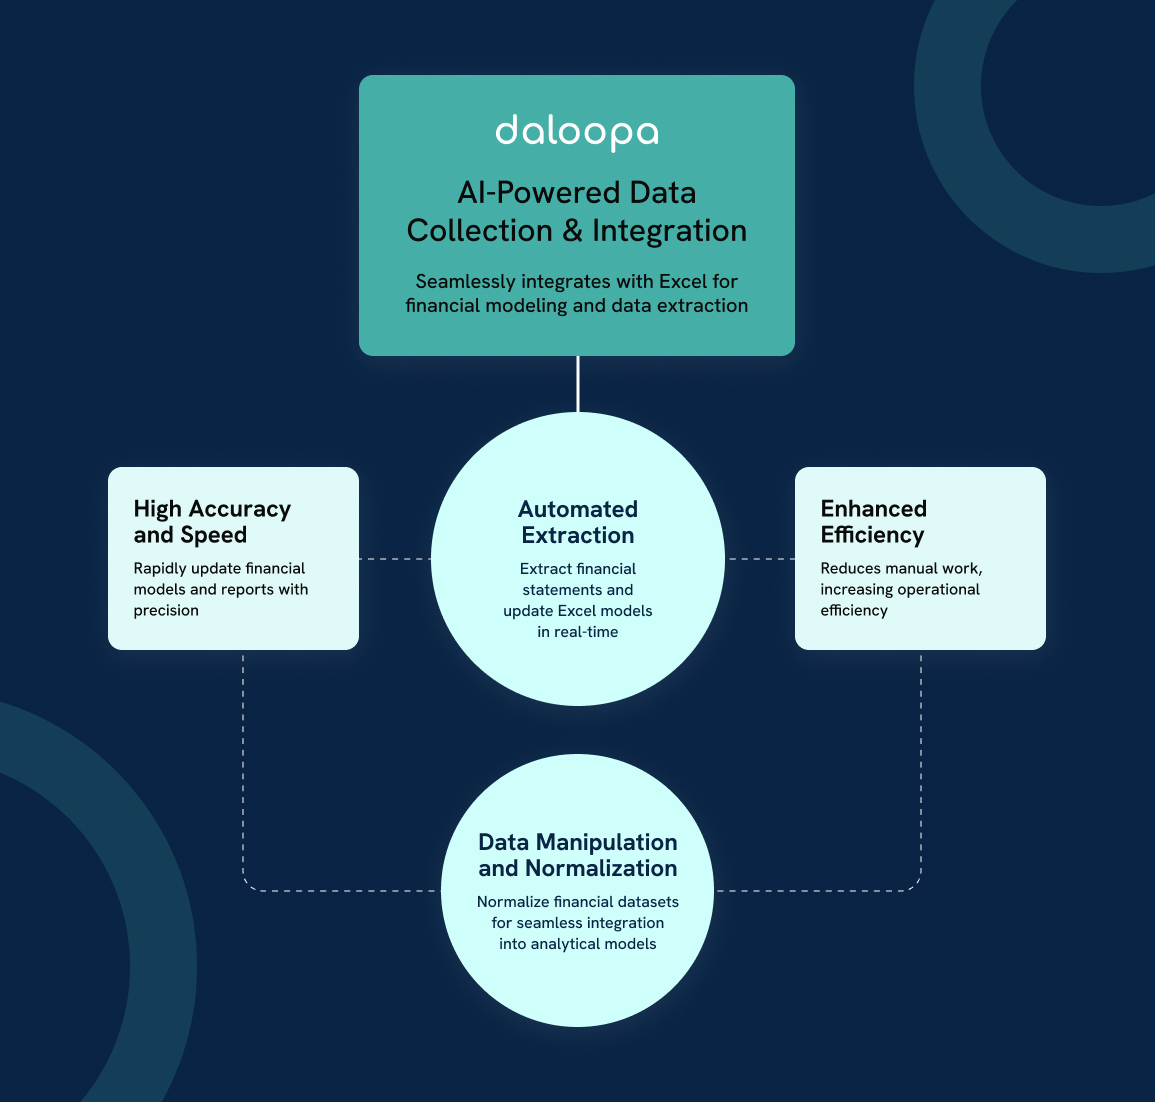
- Daloopa: Automates financial data extraction and integration for Excel.
- Functionality: Daloopa is an AI-powered tool designed for seamless data collection and integration, specifically for financial modeling and data extraction within Excel.
- Benefits: It automates the extraction of financial data from any document you could think of including: 8-K, 10-Q, 10-K, S-1, S-3, S-4, 20-F, etc, ensuring high accuracy and speed in updating financial models and reports, thereby significantly enhancing efficiency.
- Example Use for Data Collection: Daloopa can automatically extract financial statements from earnings reports and instantly update Excel models in real-time, reducing the need for manual data entry and greatly increasing operational efficiency.
- Example Use For Manipulation and Normalization: A data analyst might use Daloopa to normalize financial datasets, ensuring that future data can be automatically integrated into analytical models, thus enhancing the reliability and efficiency of financial analysis.
- FRED (Federal Reserve Economic Data): Provides real-time economic data directly into Excel.
- Functionality: Provides access to a wide range of economic data that can be directly integrated with Excel. It offers real-time data on various economic indicators.
- Benefits: Simplifies accessing and using economic data by allowing users to import data series directly into their spreadsheets, customize data ranges, and perform immediate analyses. Ensures accurate and up-to-date information, enhancing the quality of financial analyses.
- Example Use: An economist might use the FRED add-in to track key economic indicators like GDP, unemployment rates, and interest rates, integrating this data into economic models to inform forecasts and analyses.
- PitchBook Add-in: Offers access to comprehensive financial data and analytics within Excel.
- Functionality: Offers online and Excel integration for financial data and analysis, providing users with access to a comprehensive database of financial information and analytics tools.
- Benefits: Allows users to seamlessly access and analyze a wide range of financial data, create customizable templates, and perform detailed analysis, all within Excel.
- Example Use: A private equity analyst might use the PitchBook Add-in to gather and analyze financial data for potential investments, create customized financial models, and perform comprehensive comps analysis to inform investment decisions.
- Refinitiv: Offers financial data and analysis tools for market research.
- Functionality: Offers a range of financial data and analytics products, including Eikon and Datastream, providing comprehensive market data, research, and analysis tools.
- Benefits: Provides access to extensive financial information, analytics, and collaboration tools to support investment research and decision-making.
- Example Use: An economist might use Refinitiv Datastream to analyze historical economic data, forecast trends, and create detailed economic models and reports.
- Bloomberg: Provides real-time and historical financial data and analytics.
- Functionality: A global provider of financial news, data, and analytics. Bloomberg Terminal offers real-time and historical financial data, news, and analytics tools for professionals in finance, investment, and risk management.
- Benefits: Provides timely and accurate financial information, advanced analytics, and powerful trading tools to support investment decisions and market analysis.
- Example Use: A trader might use the Bloomberg Terminal to monitor real-time market data, analyze historical price trends, and execute trades directly from the platform.
- Thomson Reuters Eikon: Supplies real-time market data and analytics tools.
- Functionality: A financial information platform providing real-time and historical market data, news, and analytics tools for financial professionals.
- Benefits: Offers a vast range of financial data, advanced analytics, and collaboration tools to support trading, investment, and market analysis.
- Example Use: A portfolio manager might use Thomson Reuters Eikon to track market movements, analyze economic indicators, and communicate with colleagues to develop investment strategies.
- Cube Add-ins: Connects Excel to various financial data sources for dynamic reporting.
- Functionality: Connects Excel to financial data sources like databases, OLAP cubes, and cloud-based services.
- Benefits: Enables dynamic reporting by pulling real-time data, creating pivot tables, and charts that update automatically as the underlying data changes.
- Example Use: Generating real-time performance dashboards that integrate data from multiple sources, providing a comprehensive view of financial metrics.
- SourceScrub: Offers detailed information on privately-held companies for analysis.
- Functionality: A data platform that provides detailed information on privately-held companies, focusing on financial data, market research, and analytics.
- Benefits: Helps investors, analysts, and researchers identify and analyze private company data, track market trends, and find investment opportunities.
- Example Use: A private equity analyst might use SourceScrub to gather data on potential acquisition targets, analyze their financial performance, and assess market positioning.
- FactSet: Offers integrated data and analytics for investment analysis.
- Functionality: A financial data and software company that provides integrated data and analytics for investment professionals. It offers access to extensive financial data, market research, and analytics tools.
- Benefits: Enhances decision-making by providing comprehensive financial data, customizable analytics, and powerful visualization tools, all integrated within a single platform.
- Example Use: An equity analyst might use FactSet to gather financial data on publicly traded companies, analyze key financial metrics, and generate detailed financial models and reports.
- CapIQ (S&P Capital IQ): Provides extensive financial data and analytics tools for in-depth analysis.
- Functionality: A powerful data and analytics platform integrated with Excel. It provides extensive financial data, market research, and analytics tools, allowing users to perform in-depth analysis directly within Excel.
- Benefits: Offers a comprehensive database of financial information, including company financials, market data, and industry trends. This integration enables users to seamlessly access and analyze data without leaving Excel.
- Example Use: An investment banker might use CapIQ to pull financial data for a set of comparable companies, analyze key financial metrics, and create a detailed comps analysis for a valuation report.
- Morningstar Direct: Provides data and analytics on investment products.
- Functionality: An investment analysis platform providing comprehensive data and analytics on mutual funds, ETFs, stocks, and other investment products.
- Benefits: Helps investment professionals perform detailed analysis, monitor portfolios, and generate investment reports with access to extensive data and research tools.
- Example Use: A financial advisor might use Morningstar Direct to evaluate mutual fund performance, compare investment options, and create client reports with detailed insights and recommendations.
- YCharts: Enhances investment research with comprehensive data and tools.
- Functionality: A financial data and analysis platform focused on providing investment research tools, including data on stocks, mutual funds, and ETFs.
- Benefits: Enhances investment research with intuitive tools, comprehensive data, and powerful analytics to support portfolio management and investment decision-making.
- Example Use: An investment advisor might use YCharts to compare mutual fund performance, analyze stock trends, and generate client presentations with detailed investment insights.
- Power Query: Automates data import, cleaning, and merging.
- Functionality: Power Query is an Excel add-in designed to simplify data collection and transformation. It allows users to import data from various sources such as databases, web pages, and spreadsheets. Users can clean, reshape, and merge this data without manual entry.
- Benefits: Power Query enables the creation of repeatable processes, automating recurring data preparation tasks to save time and reduce errors. It handles large volumes of data efficiently, making it essential for financial analysis. The add-in supports complex queries, allowing for easy manipulation of data, and its integration with Excel ensures a seamless workflow.
- Example Use: A financial analyst might use Power Query to import and clean financial data from multiple sources, then reshape and merge it into a single, unified dataset for analysis.
- Preqin: Provides data and insights for informed alternative asset investments.
- Functionality: Provides comprehensive data and intelligence on the alternative assets market, including private equity, venture capital, hedge funds, real estate, infrastructure, and private debt.
- Benefits: Offers insights and analytics to help professionals make informed investment decisions, track market trends, and identify investment opportunities.
- Example Use: An investment manager might use Preqin to research potential private equity funds, analyze performance metrics, and track industry trends to inform investment strategies.
- Ablebits: Offers advanced data cleaning, analysis, and visualization tools.
- Functionality: Ablebits offers advanced data cleaning and manipulation features, crucial for financial data analysis. It includes tools for data analysis, batch processing, and advanced formatting.
- Benefits: Ablebits enhances data quality by providing tools to remove duplicates, split and merge columns, and perform other data tidying tasks. It simplifies creating pivot tables and charts, helping visualize data trends and insights more effectively.
- Example Use: A data analyst might use Ablebits to clean large datasets of transaction records, removing duplicates and correcting inconsistencies to ensure reliable data for financial analysis.
- ASAP Utilities: Enhances productivity with tools for data manipulation and formatting.
- Functionality: Provides a wide range of utilities to enhance productivity in Excel, including tools for data manipulation, formatting, and analysis.
- Benefits: Speeds up common tasks and improves workflow efficiency, helping users handle large datasets and complex spreadsheets with ease.
- Example Use: Automating repetitive tasks and improving data manipulation processes, such as quickly cleaning and formatting a large dataset, removing duplicates, splitting text into columns, and applying consistent formatting across the spreadsheet.
- Professor Excel Tools: Assists in cleaning data and automating repetitive tasks.
- Functionality: Included in Power User, helps handle big data sets more effectively. Assists in cleaning data, automating repetitive tasks, and creating visually appealing reports.
- Benefits: Saves time and reduces the potential for errors by automating the creation of monthly financial summaries and other repetitive tasks. Integrates seamlessly with Excel, allowing users to focus on analysis and decision-making.
- Example Use: A financial analyst could use Professor Excel Tools to automate the creation of monthly financial reports, ensuring consistency and accuracy while saving time.
Key Benefits of Data-Focused Excel Add-Ins
- Time Savings: Automate repetitive data collection and integration tasks, freeing up valuable time for analysis and strategic thinking.
- Improved Accuracy: Reduce human error in data entry and manipulation through automated processes and data validation features.
- Real-Time Insights: Access up-to-the-minute financial data and market information directly within Excel spreadsheets.
- Enhanced Data Visualization: Create more compelling and interactive charts and graphs to better communicate financial insights.
- Seamless Integration: Connect Excel with various data sources and financial platforms, creating a more unified analytical environment.
Maximizing the Impact of Data Collection Add-Ins
To truly harness the power of these add-ins, financial analysts should:
- Assess Specific Needs: Identify the most pressing data challenges in your workflow and select add-ins that address these specific issues.
- Integrate with Existing Systems: Ensure that chosen add-ins can seamlessly integrate with your organization’s existing financial software and data sources.
- Prioritize Data Security: Given the sensitive nature of financial data, select add-ins that offer robust security features and comply with relevant data protection regulations.
- Invest in Training: Provide thorough training for team members to ensure they can fully leverage the capabilities of these powerful tools.
- Stay Updated: Regularly update your add-ins and stay informed about new features and improvements to maintain peak performance and security.
Empowering Financial Analysis Through Advanced Data Tools
In an era where data is king, Excel add-ins for data collection and integration are indispensable allies for financial analysts. These tools not only enhance productivity and accuracy but also open up new possibilities for deeper, more insightful financial analysis. By leveraging the right combination of add-ins, analysts can transform Excel from a simple spreadsheet application into a powerful data management and analysis platform, driving better financial decision-making and strategic insights.
Avoid the snowball effect caused by basic data type mismatches with these add-ins. The tools help analysts across the world normalize and easily manipulate data for analysis no matter what kind of systems you’ve already built.


