
At its best software like Excel helps organize and action complex data into a format everyone on a team can comfortably work with, but all too often the basics of data collection and formatting can cause unnecessary headaches. As anyone who has ever spent a late night hunched over mysteriously broken formulas can attest to, having the right tools can make all the difference.
Whether you’re processing data or attempting to build the next great financial models. The right Excel integrations can transform simple spreadsheets into robust financial platforms. Choosing the best Excel add-ins for data analysis in finance helps enhance productivity, streamline reporting, and improve decision-making. These Excel add-ins are designed to manage and report financial data efficiently, ensuring that your analyses are both accurate and insightful, especially when you’re under tight deadlines.
Key Takeaways
- Choosing the best Excel add-ins enhances productivity without having to work within siloed software tools or wait for developers to create what you need.
- Integration with external data can cut the time spent collecting data for decision-making.
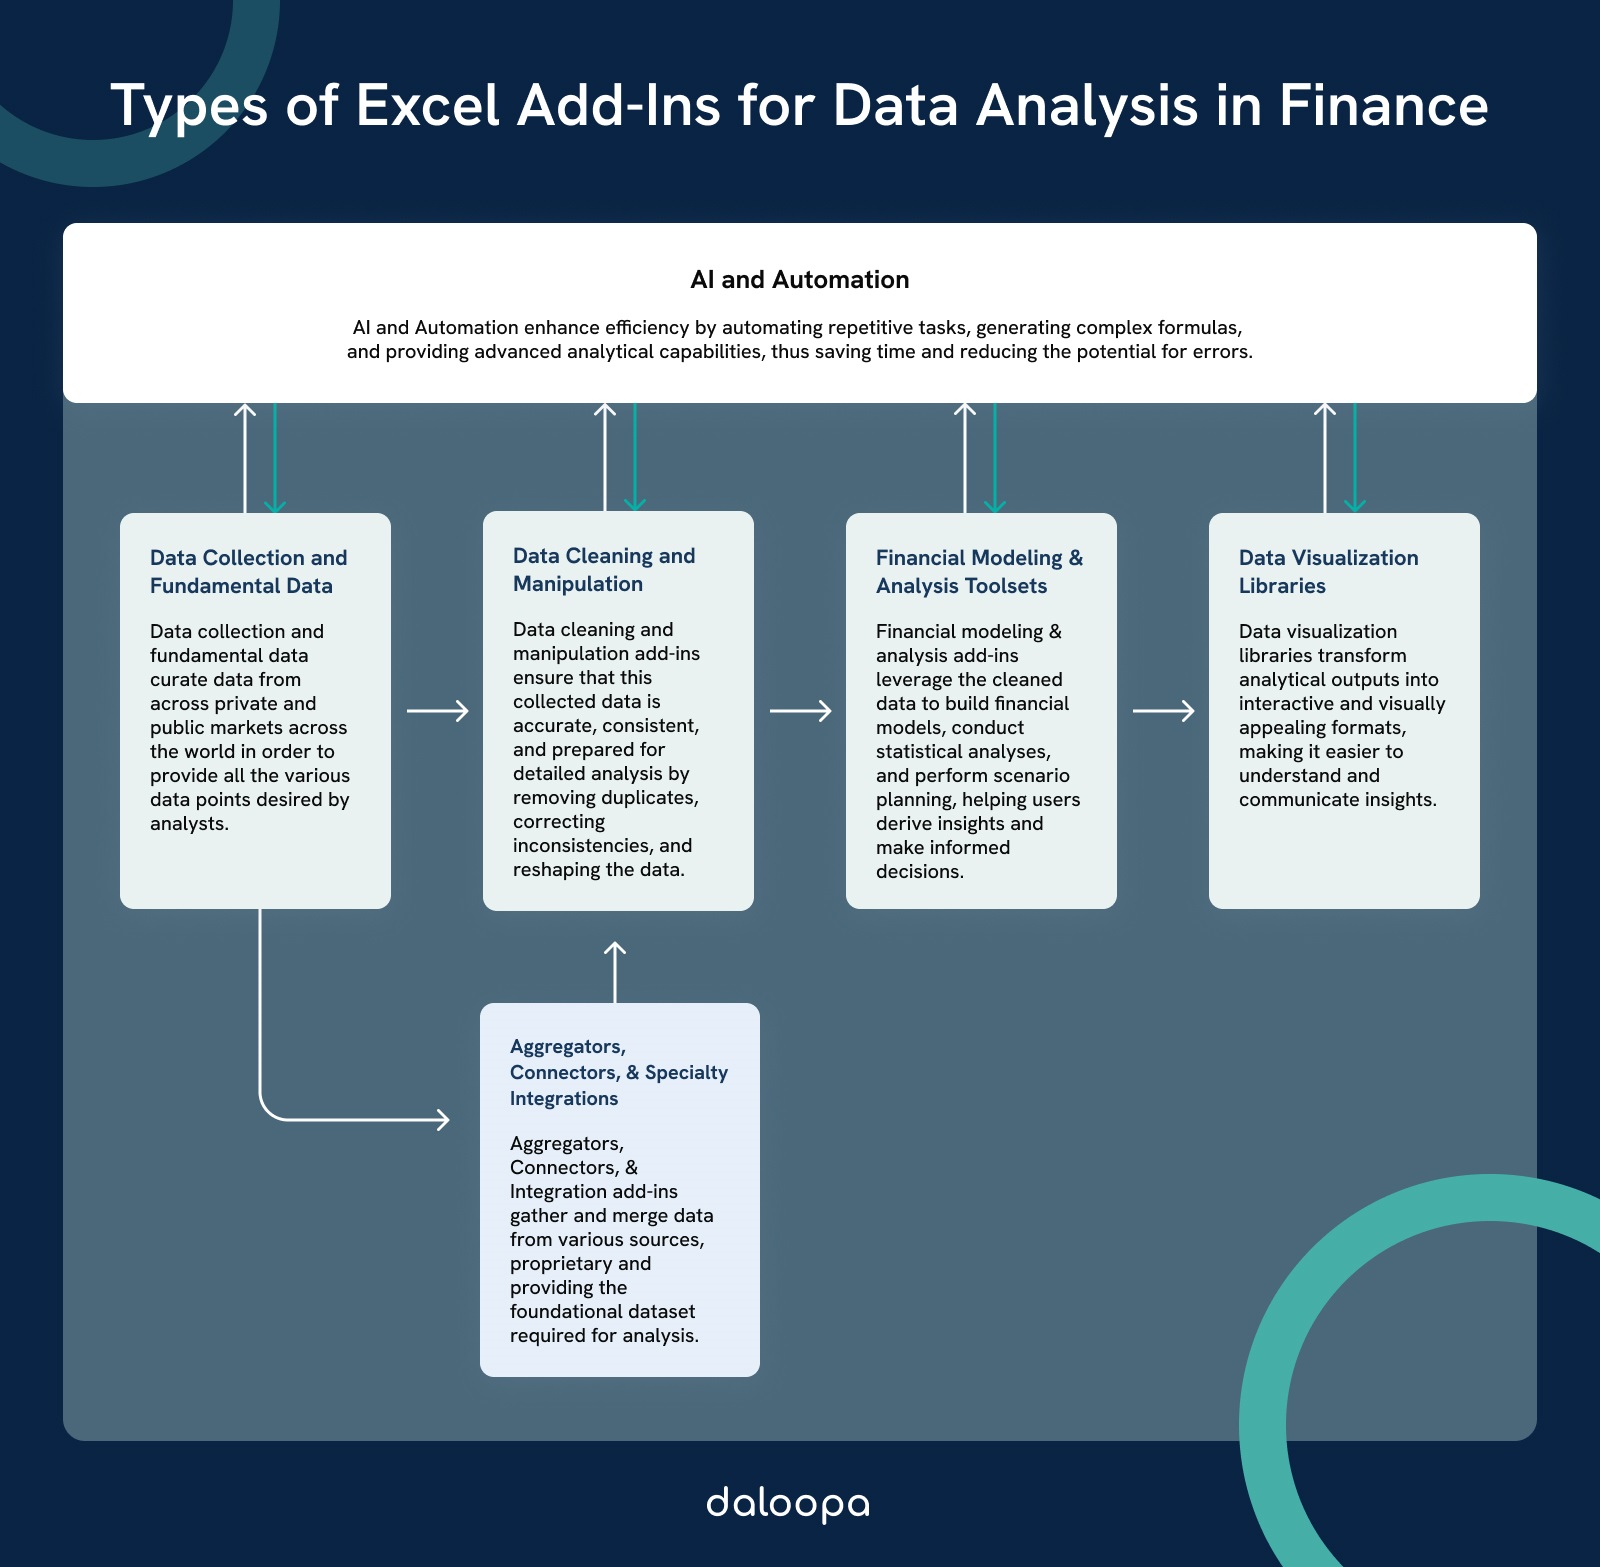
- Excel add-ins for financial analysis generally fall into 5 main categories:
40 of the Best Excel Add-Ins for Financial Data Analysis
When handling financial data analysis, using Microsoft Excel add-ins can significantly enhance our productivity and accuracy. Below, we explore the best tools available for financial data analysis, covering all options currently on the market at present no matter what you’re looking for.
1. Data Collection and Integration Tools
These tools focus on gathering and integrating data from various sources into Excel, ensuring a unified dataset for analysis. While most of the data provided by these tools is publicly available, a few of these aggregate data that’s proprietary or hard to access, and crucially save thousands of hours a year searching through random PDFs & CSVs.
- SQL Spreads: Integrates Excel with SQL databases for seamless data management.
- Functionality: Integrates Excel with SQL databases for seamless data management.
- Benefits: Allows users to read and write data between Excel and SQL databases, simplifying data updates and analysis.
- Example Use: Updating financial data in SQL databases directly from Excel spreadsheets, ensuring data consistency and reducing manual entry errors.
- Daloopa: Automates financial data extraction and integration for Excel.
- Functionality: Daloopa is an AI-powered tool designed for seamless data collection and integration, specifically for financial modeling and data extraction within Excel.
- Benefits: It automates the extraction of financial data from any document you could think of including: 8-K, 10-Q, 10-K, S-1, S-3, S-4, 20-F, etc, ensuring high accuracy and speed in updating financial models and reports, thereby significantly enhancing efficiency.
- Example Use: Daloopa can automatically extract financial statements from earnings reports and instantly update Excel models in real-time, reducing the need for manual data entry and greatly increasing operational efficiency.
- FRED (Federal Reserve Economic Data): Provides real-time economic data directly into Excel.
- Functionality: Provides access to a wide range of economic data that can be directly integrated with Excel. It offers real-time data on various economic indicators.
- Benefits: Simplifies accessing and using economic data by allowing users to import data series directly into their spreadsheets, customize data ranges, and perform immediate analyses. Ensures accurate and up-to-date information, enhancing the quality of financial analyses.
- Example Use: An economist might use the FRED add-in to track key economic indicators like GDP, unemployment rates, and interest rates, integrating this data into economic models to inform forecasts and analyses.
- PitchBook Add-in: Offers access to comprehensive financial data and analytics within Excel.
- Functionality: Offers online and Excel integration for financial data and analysis, providing users with access to a comprehensive database of financial information and analytics tools.
- Benefits: Allows users to seamlessly access and analyze a wide range of financial data, create customizable templates, and perform detailed analysis, all within Excel.
- Example Use: A private equity analyst might use the PitchBook Add-in to gather and analyze financial data for potential investments, create customized financial models, and perform comprehensive comps analysis to inform investment decisions.
- Refinitiv: Offers financial data and analysis tools for market research.
- Functionality: Offers a range of financial data and analytics products, including Eikon and Datastream, providing comprehensive market data, research, and analysis tools.
- Benefits: Provides access to extensive financial information, analytics, and collaboration tools to support investment research and decision-making.
- Example Use: An economist might use Refinitiv Datastream to analyze historical economic data, forecast trends, and create detailed economic models and reports.
- Bloomberg: Provides real-time and historical financial data and analytics.
- Functionality: A global provider of financial news, data, and analytics. Bloomberg Terminal offers real-time and historical financial data, news, and analytics tools for professionals in finance, investment, and risk management.
- Benefits: Provides timely and accurate financial information, advanced analytics, and powerful trading tools to support investment decisions and market analysis.
- Example Use: A trader might use the Bloomberg Terminal to monitor real-time market data, analyze historical price trends, and execute trades directly from the platform.
- Thomson Reuters Eikon: Supplies real-time market data and analytics tools.
- Functionality: A financial information platform providing real-time and historical market data, news, and analytics tools for financial professionals.
- Benefits: Offers a vast range of financial data, advanced analytics, and collaboration tools to support trading, investment, and market analysis.
- Example Use: A portfolio manager might use Thomson Reuters Eikon to track market movements, analyze economic indicators, and communicate with colleagues to develop investment strategies.
- Cube Add-ins: Connects Excel to various financial data sources for dynamic reporting.
- Functionality: Connects Excel to financial data sources like databases, OLAP cubes, and cloud-based services.
- Benefits: Enables dynamic reporting by pulling real-time data, creating pivot tables, and charts that update automatically as the underlying data changes.
- Example Use: Generating real-time performance dashboards that integrate data from multiple sources, providing a comprehensive view of financial metrics.
- SourceScrub: Offers detailed information on privately-held companies for analysis.
- Functionality: A data platform that provides detailed information on privately-held companies, focusing on financial data, market research, and analytics.
- Benefits: Helps investors, analysts, and researchers identify and analyze private company data, track market trends, and find investment opportunities.
- Example Use: A private equity analyst might use SourceScrub to gather data on potential acquisition targets, analyze their financial performance, and assess market positioning.
- FactSet: Offers integrated data and analytics for investment analysis.
- Functionality: A financial data and software company that provides integrated data and analytics for investment professionals. It offers access to extensive financial data, market research, and analytics tools.
- Benefits: Enhances decision-making by providing comprehensive financial data, customizable analytics, and powerful visualization tools, all integrated within a single platform.
- Example Use: An equity analyst might use FactSet to gather financial data on publicly traded companies, analyze key financial metrics, and generate detailed financial models and reports.
- CapIQ (S&P Capital IQ): Provides extensive financial data and analytics tools for in-depth analysis.
- Functionality: A powerful data and analytics platform integrated with Excel. It provides extensive financial data, market research, and analytics tools, allowing users to perform in-depth analysis directly within Excel.
- Benefits: Offers a comprehensive database of financial information, including company financials, market data, and industry trends. This integration enables users to seamlessly access and analyze data without leaving Excel.
- Example Use: An investment banker might use CapIQ to pull financial data for a set of comparable companies, analyze key financial metrics, and create a detailed comps analysis for a valuation report.
- Morningstar Direct: Provides data and analytics on investment products.
- Functionality: An investment analysis platform providing comprehensive data and analytics on mutual funds, ETFs, stocks, and other investment products.
- Benefits: Helps investment professionals perform detailed analysis, monitor portfolios, and generate investment reports with access to extensive data and research tools.
- Example Use: A financial advisor might use Morningstar Direct to evaluate mutual fund performance, compare investment options, and create client reports with detailed insights and recommendations.
- YCharts: Enhances investment research with comprehensive data and tools.
- Functionality: A financial data and analysis platform focused on providing investment research tools, including data on stocks, mutual funds, and ETFs.
- Benefits: Enhances investment research with intuitive tools, comprehensive data, and powerful analytics to support portfolio management and investment decision-making.
- Example Use: An investment advisor might use YCharts to compare mutual fund performance, analyze stock trends, and generate client presentations with detailed investment insights.
- Power Query
- Functionality: Power Query is an Excel add-in designed to simplify data collection and transformation. It allows users to import data from various sources such as databases, web pages, and spreadsheets. Users can clean, reshape, and merge this data without manual entry.
- Benefits: Power Query enables the creation of repeatable processes, automating recurring data preparation tasks to save time and reduce errors. It handles large volumes of data efficiently, making it essential for financial analysis. The add-in supports complex queries, allowing for easy manipulation of data, and its integration with Excel ensures a seamless workflow.
- Example Use: A financial analyst might use Power Query to import and clean financial data from multiple sources, then reshape and merge it into a single, unified dataset for analysis.
- Preqin: Provides data and insights for informed alternative asset investments.
- Functionality: Provides comprehensive data and intelligence on the alternative assets market, including private equity, venture capital, hedge funds, real estate, infrastructure, and private debt.
- Benefits: Offers insights and analytics to help professionals make informed investment decisions, track market trends, and identify investment opportunities.
- Example Use: An investment manager might use Preqin to research potential private equity funds, analyze performance metrics, and track industry trends to inform investment strategies.
2. Data Normalization and Manipulation Tools
Avoid the snowball effect caused by basic data type mismatches with these add-ins. The tools below help analysts across the world normalize and easily manipulate data for analysis no matter what kind of systems you’ve already built.
- Ablebits: Offers advanced data cleaning, analysis, and visualization tools.
- Functionality: Ablebits offers advanced data cleaning and manipulation features, crucial for financial data analysis. It includes tools for data analysis, batch processing, and advanced formatting.
- Benefits: Ablebits enhances data quality by providing tools to remove duplicates, split and merge columns, and perform other data tidying tasks. It simplifies creating pivot tables and charts, helping visualize data trends and insights more effectively.
- Example Use: A data analyst might use Ablebits to clean large datasets of transaction records, removing duplicates and correcting inconsistencies to ensure reliable data for financial analysis.
- ASAP Utilities: Enhances productivity with tools for data manipulation and formatting.
- Functionality: Provides a wide range of utilities to enhance productivity in Excel, including tools for data manipulation, formatting, and analysis.
- Benefits: Speeds up common tasks and improves workflow efficiency, helping users handle large datasets and complex spreadsheets with ease.
- Example Use: Automating repetitive tasks and improving data manipulation processes, such as quickly cleaning and formatting a large dataset, removing duplicates, splitting text into columns, and applying consistent formatting across the spreadsheet.
- Professor Excel Tools: Assists in cleaning data and automating repetitive tasks.
- Functionality: Included in Power User, helps handle big data sets more effectively. Assists in cleaning data, automating repetitive tasks, and creating visually appealing reports.
- Benefits: Saves time and reduces the potential for errors by automating the creation of monthly financial summaries and other repetitive tasks. Integrates seamlessly with Excel, allowing users to focus on analysis and decision-making.
- Example Use: A financial analyst could use Professor Excel Tools to automate the creation of monthly financial reports, ensuring consistency and accuracy while saving time.
3. Financial Modeling and Analysis Tools
These tools are used for financial modeling, scenario analysis, and statistical analysis to support decision-making.
- Macabacus: Streamlines financial modeling with productivity enhancements.
- Functionality: Geared towards financial modeling, offering productivity enhancements, advanced formula auditing, error reduction tools, and robust shortcuts.
- Benefits: Enhances efficiency in financial modeling tasks by providing a suite of tools that streamline the modeling process, reducing the time spent on repetitive tasks.
- Example Use: Creating detailed financial models for a company using built-in templates for balance sheets, income statements, and cash flow statements, while leveraging shortcuts to quickly audit formulas and ensure accuracy.
- Monte Carlo Add-In: Performs Monte Carlo simulations for risk analysis.
- Functionality: Allows users to perform Monte Carlo simulations within Excel. This tool helps in risk analysis by simulating various outcomes based on different inputs and assumptions.
- Benefits: Provides a probabilistic approach to decision making, helping users understand potential risks and rewards by modeling a wide range of possible scenarios.
- Example Use: A financial planner could use the Monte Carlo Add-In to simulate retirement portfolio outcomes based on different investment returns and withdrawal rates, helping clients understand the likelihood of achieving their financial goals.
- Solver: Optimizes financial models by adjusting decision variables.
- Functionality: Used for optimization tasks. It helps find the best solution for problems involving multiple constraints and objectives, making it useful in financial modeling.
- Benefits: Adjusts the values in decision variables to achieve the desired outcome, adhering to set constraints. It is beneficial for performing scenario analysis, providing a range of possible outcomes based on different assumptions.
- Example Use: An investment manager might use Solver to optimize an investment portfolio, determining the best allocation of assets to maximize returns while minimizing risk.
- Model Analyzer: Provides tools for scenario and statistical analysis.
- Functionality: Provides multiple solutions for Excel modeling, including statistical analysis, what-if analysis (with tornado charts, spider charts, and sensitivity tables), scenario analysis, multiple goal seek, break-even analysis, and Monte Carlo simulations.
- Benefits: Centralizes input and output variables in spreadsheets, enabling sophisticated financial analysis and decision-making.
- Example Use: A financial analyst might use Model Analyzer to perform detailed scenario analysis and Monte Carlo simulations to evaluate the potential outcomes of different investment strategies.
- Analysis ToolPack: Allows advanced statistical analysis within Excel.
- Functionality: A Microsoft add-in that allows statistical analysis such as correlation analysis, descriptive statistics, and histograms.
- Benefits: Provided on every computer using Excel 2007 and later, both Mac and PC, enhancing the capability to perform advanced statistical analysis within Excel.
- Example Use: A statistician might use the Analysis ToolPack to perform correlation analysis and generate descriptive statistics for a large dataset.
- StatPlus: Offers comprehensive statistical analysis tools.
- Functionality: A statistical analysis package that works on both Mac and PC. It allows analysis of correlations, regressions, time series, and data processing, and creates statistical charts.
- Benefits: One of the few Excel add-ins for statistics that works on Mac, providing comprehensive statistical analysis tools.
- Example Use: A researcher might use StatPlus to analyze time series data and create regression models to understand trends and patterns in their data.
- Simtools: Enhances statistical analysis with Monte Carlo simulations.
- Functionality: Adds 32 statistical functions to perform Monte Carlo simulations and risk analysis in Excel spreadsheets.
- Benefits: Covers a range of functions for cumulative probability, correlations among random variables, decision analysis, regression analysis, and more, enhancing the capability for sophisticated statistical analysis.
- Example Use: A risk analyst might use Simtools to perform Monte Carlo simulations and assess the probability of different risk scenarios impacting their portfolio.
- XLSTAT: Provides tools for advanced statistical analysis.
- Functionality: An add-on with about 100 features for advanced statistical analysis, including linear and non-linear regressions, k-means clustering, and principal component analysis.
- Benefits: Highly compatible, working on both PC and Mac, and provides a wide range of tools for comprehensive statistical analysis.
- Example Use: A data scientist might use XLSTAT to perform principal component analysis and k-means clustering to identify patterns and relationships in their data.
- Analystix Tools: Includes essential tools for financial analysis and visualization.
- Functionality: Provides tools for financial analysis, including calculating CAGR, WACC, Black & Scholes formula, histogram building, and date arranging.
- Benefits: Includes essential tools for financial analysis and visualization, working on Excel 2010 and later on PC.
- Example Use: A financial analyst might use Analystix Tools to calculate the weighted average cost of capital (WACC) for a company and visualize the distribution of financial data using histograms.
- Power Pivot: Builds complex data models and interactive dashboards in Excel.
- Functionality: Extends Excel’s capabilities by allowing users to build more complex data models with millions of rows, far beyond the standard Excel limitations. It lets users create relationships between different data tables, crucial for comprehensive analysis.
- Benefits: Offers advanced data manipulation features like calculated columns and measures, enabling complex calculations and quick insights. It also provides robust data visualization options, allowing for the creation of interactive dashboards and reports within Excel.
- Example Use: A financial analyst could use Power Pivot to build a detailed data model that connects sales data, customer information, and product details, creating interactive dashboards to visualize sales performance and trends.
- Datarails: Automates Excel FP&A for accurate, efficient financial planning.
- Functionality: Financial planning and analysis (FP&A) software that connects with Excel.
- Benefits: Automates data consolidation, reporting, and analysis, improving accuracy and efficiency in financial planning.
- Example Use: Streamlining the budgeting process by consolidating financial data from multiple sources and generating comprehensive reports.
4. Data Visualization Tools
These add-ins enhance data presentation through advanced visualizations and interactive dashboards. There are a variety of tools available depending on what specific visuals and formats you’re attempting to achieve but overall nothing communicates analysis better than a high quality visual.
- Tableau: Creates interactive dashboards and reports from Excel data.
- Functionality: Data visualization tool that integrates with Excel to create interactive dashboards and reports.
- Benefits: Enhances data analysis with advanced visualizations, making it easier to identify trends and insights from large data sets.
- Example Use: Creating interactive financial dashboards that allow users to drill down into specific metrics and visualize data trends over time.
- Power BI for Excel: Integrates Power BI tools for dynamic data visualization.
- Functionality: Integrates Power BI’s powerful data visualization and business intelligence tools directly within Excel.
- Benefits: Enhances Excel’s data analysis capabilities by allowing users to create interactive reports, share insights, and collaborate on data visualizations seamlessly between Excel and Power BI.
- Example Use: A business analyst might use Power BI for Excel to build dynamic dashboards that combine data from multiple sources, providing a comprehensive view of business performance.
- Plotly for Excel: Brings advanced graphing capabilities to Excel.
- Functionality: An add-in that brings Plotly’s advanced graphing and visualization capabilities to Excel.
- Benefits: Allows users to create high-quality, interactive charts and graphs directly within Excel, enhancing the visual appeal and functionality of data presentations.
- Example Use: A financial analyst might use Plotly for Excel to create interactive stock price charts that allow users to explore historical trends and compare performance over time.
- Charticulator: Allows custom chart designs within Excel.
- Functionality: A data visualization tool that allows users to create custom, reusable chart designs directly within Excel.
- Benefits: Provides flexibility in designing bespoke visualizations that are not possible with standard chart types, enhancing the ability to communicate complex data insights.
- Example Use: A market researcher might use Charticulator to design unique visualizations that showcase survey results in an engaging and informative way.
- XLCubed: Enhances reporting capabilities with interactive visualizations.
- Functionality: An Excel add-in that enhances data analysis and reporting capabilities, allowing users to connect to OLAP cubes, relational databases, and other data sources.
- Benefits: Provides advanced tools for creating interactive reports, dashboards, and data visualizations, making it easier to analyze and present complex data.
- Example Use: A financial controller might use XLCubed to build detailed financial reports that integrate data from various sources, providing insights into financial performance and trends.
- D3.js for Excel: Integrates D3.js for sophisticated data visualizations.
- Functionality: Integrates the powerful D3.js (Data-Driven Documents) JavaScript library with Excel to create highly customizable and interactive data visualizations.
- Benefits: Allows users to leverage the full capabilities of D3.js within Excel, enabling the creation of sophisticated visualizations that go beyond standard charting options.
- Example Use: A data scientist might use D3.js for Excel to build interactive network diagrams that visualize relationships between different data points, providing deeper insights into data structures.
- ChartExpo: Simplifies creating complex and visually appealing charts.
- Functionality: An Excel add-in that provides a wide range of advanced charting options and visualizations.
- Benefits: Simplifies the process of creating complex and visually appealing charts, enabling users to convey data insights more effectively.
- Example Use: A data analyst might use ChartExpo to create interactive dashboards and infographics that highlight key business metrics and trends.
5. AI and Automation Tools
Finally AI and automation tools will soon permeate all aspects of our day to day work. As it stands right now, there are still quite a few tools specialized in improving efficiency with minimal additional effort from the user. If you’re looking to save time these tools could revolutionize your workflow, although many of the ones above already have or are planning to roll out integrated AI.
- Excel Formula Bot: Assists with creating complex Excel formulas using AI.
- Functionality: AI-powered tool that assists with creating complex Excel formulas.
- Benefits: Simplifies the process of writing and debugging Excel formulas, saving time and reducing errors.
- Example Use: Generating complex financial formulas and functions quickly by inputting natural language queries, enhancing productivity.
- AI Excel Bot: Automates tasks and generates insights with AI features.
- Functionality: AI-driven assistant for automating tasks and generating insights in Excel.
- Benefits: Enhances Excel capabilities with AI features that automate data analysis, visualization, and reporting.
- Example Use: Automating routine data analysis tasks and generating insightful visualizations, allowing users to focus on higher-level strategic work.
- Daloopa: Automates financial modeling and data extraction, enhancing efficiency.
- Functionality: AI-powered financial modeling and data extraction tool for Excel.
- Benefits: Automates the extraction of financial data from documents, updating models and reports with high accuracy and speed.
- Example Use: Extracting financial statements from earnings reports and updating Excel models in real-time, reducing manual data entry and increasing efficiency.
21 Uses for Excel Add-Ins for Finance Professionals in IB & PE
Excel add-ins are invaluable tools for investment bankers and private equity analysts looking to supercharge their ability to handle complex financial analyses, streamline workflows, improve data accuracy, and save time. These add-ins extend Excel’s native functionality, making it a more powerful and versatile tool for financial professionals. Read on to learn what these add-ins can do and why they matter:
- Valuation Models
Creating accurate valuation models is a fundamental task for investment bankers. Excel add-ins can provide advanced templates and functionalities for building Discounted Cash Flow (DCF) models, Leveraged Buyout (LBO) models, and Comparable Company Analysis (CCA). These tools streamline the process of forecasting cash flows, calculating terminal values, and determining appropriate discount rates, which are essential for assessing the value of companies.
- Mergers & Acquisitions (M&A)
In M&A activities, investment bankers build accretion/dilution models to evaluate the financial impact of potential mergers and acquisitions. Add-ins can simplify the creation of these models, enabling bankers to analyze how a merger will affect earnings per share (EPS) and other key financial metrics. These tools facilitate the comparison of various transaction structures and their implications on shareholder value.
- Real-Time Data Access
Access to real-time financial data is crucial for making timely and informed decisions. Add-ins like Daloopa offer integrated real-time market data and fundamental data right in your current Excel models. While others like Bloomberg allow users to pull live news feeds and analytics into their work from the Terminal directly into their spreadsheets. These add-ins ensure that investment bankers have up-to-date information at their fingertips, enabling them to respond quickly to market changes.
- Pro Forma Financial Statements
Preparing pro forma financial statements is crucial for budgeting and forecasting. Add-ins can provide powerful tools for creating projected income statements, balance sheets, and cash flow statements. These add-ins offer advanced functionalities such as multi-year forecasting, rolling budgets, and integration with existing financial data, allowing for more accurate and dynamic financial planning.
- Scenario Analysis
Scenario analysis helps investment bankers analyze different financial outcomes based on various business scenarios and assumptions. Add-ins allow for comprehensive scenario analysis and Monte Carlo simulations. These tools enable bankers to model different economic conditions, changes in market dynamics, and strategic decisions, assessing their potential impact on financial performance.
- Beyond pivot Tables and Basic Charts
Excel’s native pivot tables and charts are further enhanced by add-ins that can integrate & summarize large datasets, creating dynamic reports that identify trends and patterns. This coupled with advanced charting capabilities for creating professional presentations can make it easier to visualize complex data and communicate insights effectively.
- Sensitivity Analysis
Sensitivity analysis is vital for assessing how changes in key variables affect financial outcomes. Add-ins can provide advanced sensitivity analysis tools, helping investment bankers understand the impact of different assumptions on their models. These tools facilitate the testing of various scenarios, identifying the most significant risk factors and their potential effects on financial performance.
- Pitch Books and Deal Decks
Designing and preparing detailed presentations for client meetings, including financial summaries, market analysis, and strategic recommendations, is a key part of any analyst’s role. Add-ins can provide templates and data integration capabilities that streamline the creation of stunning slides. These tools ensure that presentations are data-driven, visually appealing, and tailored to the specific needs of clients.
- Executive Summaries
Creating concise and impactful summaries of financial analyses and recommendations is crucial for communicating with executives and clients. Many add-ins offer functionalities that facilitate the preparation of executive summaries, integrating key financial metrics and analyses into clear, concise formats. These tools help bankers present their insights and recommendations in a manner that is easy to understand and act upon.
- Portfolio Management & Performance Tracking
Private equity professionals use Excel add-ins to monitor the financial performance of portfolio companies through custom dashboards and reports. These tools allow for the integration of data from multiple sources, providing real-time insights into key performance indicators (KPIs) such as revenue growth, profitability, and operational efficiency. With interactive visualizations, these add-ins enable professionals to track and analyze performance trends, identify areas for improvement, and make data-driven decisions.
- Value Creation Plans
Developing and tracking initiatives designed to enhance the value of portfolio companies is a critical aspect of portfolio management. Add-ins offer advanced functionalities for creating and monitoring value creation plans. These tools help in setting strategic goals, budgeting, and forecasting, ensuring that initiatives are aligned with the overall value creation strategy. Regular reviews and adjustments to the plans are facilitated by the dynamic and real-time data provided by these add-ins.
- Deal Screening
Evaluating potential investment opportunities is a fundamental task for private equity professionals. Excel add-ins can provide comprehensive financial data, market analytics, and pre-built templates for financial modeling. These tools help in conducting preliminary due diligence by analyzing financial statements, market conditions, competitive landscapes, and business models. The integration of these add-ins with Excel simplifies the screening process, enabling professionals to quickly filter out less promising opportunities and focus on high-potential deals.
- Due Diligence
Once a potential investment opportunity passes the initial screening, in-depth financial analysis is performed to assess its viability. Add-ins provide access to detailed financial data, company profiles, and industry benchmarks. These tools facilitate the comprehensive review of the target company’s financial health, legal status, market position, and operational capabilities. By leveraging these add-ins, private equity professionals can perform rigorous due diligence, identifying potential risks and opportunities associated with the investment.
- Investor Reporting
Preparing detailed reports for current and potential investors is essential for maintaining transparency and building trust. Excel add-ins enable the creation of dynamic and interactive reports that include fund performance metrics, investment theses, and market analyses. These tools allow for the seamless integration of financial data, providing investors with up-to-date and comprehensive insights into the fund’s performance. Customizable templates and visualization options ensure that reports are professional and tailored to the specific needs of investors.
- Capital Call Management
Effective management of capital calls and distributions is crucial for maintaining liquidity and ensuring that funds are available when needed. A few add-ins offer robust tools for tracking capital calls, commitments, and distributions. These tools provide dashboards and reports that help in planning and managing cash flows, ensuring that capital is efficiently allocated and investors are kept informed about their contributions and returns.
- Exit Modeling
Creating models to analyze potential exit scenarios is a key part of private equity investment strategy. Add-ins can offer advanced functionalities for exit modeling, enabling professionals to project future financial performance under various scenarios, including Initial Public Offerings (IPOs), secondary sales, and strategic acquisitions. These tools help in determining the optimal exit strategy that maximizes returns for investors, providing a clear roadmap for realizing the value of investments.
- Return Analysis
Calculating metrics such as Internal Rate of Return (IRR) and Multiple on Invested Capital (MOIC) for potential exits is essential for evaluating the success of an investment. Add-ins can offer advanced statistical and data analysis functions, helping private equity professionals estimate the profitability of an exit based on current and projected performance. These tools facilitate informed decision-making by providing detailed insights into the potential returns and risks associated with different exit strategies.
- Benchmarking
Comparing the performance of portfolio companies against industry standards and peers is a crucial step in identifying areas for improvement. Excel add-ins provide access to industry benchmarks, market data, and peer comparisons. These tools help private equity professionals assess how their portfolio companies are performing relative to competitors, identifying strengths and weaknesses that can be addressed to enhance performance.
- Cost Analysis
Analyzing cost structures to identify opportunities for efficiency gains and cost savings is another important aspect of operational improvements. Add-ins provide advanced data manipulation and analysis features, such as removing duplicates, merging cells, and performing detailed cost analysis. These tools help in scrutinizing the cost base of portfolio companies, identifying areas where expenses can be reduced without compromising on quality or performance, ultimately improving margins and profitability.
- Compliance and Audit
Ensuring compliance with regulatory requirements and conducting audits are important aspects of investment banking. Add-ins can help you maintain data integrity and compliance. Allowing users to compare different versions of an Excel workbook, highlighting changes and discrepancies. In addition these add-ins focused on changelogs provide tools for tracking changes, documenting data sources, and ensuring that financial models comply with regulatory standards. In essence making sure for example that only verifiable fundamental data is used.
- Productivity and Workflow Optimization
Investment bankers often work under tight deadlines, making efficiency and productivity crucial. Add-ins like Daloopa provide a suite of tools designed to streamline various Excel tasks and improve financial analysis with AI. Others focus on offering advanced data cleaning and manipulation features, such as removing duplicates, merging cells, and splitting data into columns based on known usage patterns. These add-ins reduce the time spent on repetitive tasks, allowing analysts to focus on higher-value activities.
Differentiate yourself & excel beyond the competition with the right add-ins.
Excel add-ins are indispensable tools for investment banking analysts, enhancing their ability to perform complex financial analyses, integrate and automate data, manage risk, create compelling reports, optimize workflows, ensure compliance, and access real-time data. By leveraging these powerful tools, investment bankers can improve their efficiency, accuracy, and effectiveness in making strategic financial decisions.


