
The 2-Second Revolution in Financial Data Science
The risk alert hits your screen at 6:47 AM. Asian markets just broke correlation—a pattern your quantitative finance AI models recognize from 2008, 2015, and 2020.
Five years ago, you’d be drafting emails until lunch. Today? Your agentic analytics finance system has already written seventeen personalized briefings, each one different, each one perfect for its reader. The portfolio manager gets probabilities and position recommendations. The client gets a story about market resilience. The compliance officer gets regulatory impact analysis.
This is LLM financial analytics integration in action—and it happens in under two seconds.
Here’s exactly how it works: Your existing quantitative models keep running, untouched, processing 50,000 data points per second through proven algorithms. Now they feed into a new layer—an API-based bridge that translates mathematical truth into human understanding through automated financial reporting LLM capabilities. Statistical outputs become narratives. Correlation matrices become actionable insights. Risk metrics become decisions.
The semantic translation happens in three steps. First, your traditional models compute (100-500ms). Second, purpose-built APIs pass structured outputs to language models (200ms). Third, those models generate context-aware narratives personalized to each stakeholder (200-800ms). Total time: less than taking a sip of coffee.
This isn’t theoretical. The global asset management industry reached $128 trillion in assets under management in 2024¹, with leading institutions rapidly adopting these integrated AI portfolio management systems. Modern vendor pipelines have reduced importing and cleaning from multiple hours to minutes² through auto-mapping capabilities, fundamentally changing how analysis gets done.
The stakes define themselves: Nearly half of AI pioneers (47%) report ROI exceeding expectations³ from their advanced generative AI initiatives. Those that don’t adopt are already losing clients to those that do.
What you’re about to learn isn’t just another technical upgrade. It’s a fundamental shift in how financial intelligence moves from computation to comprehension through financial data science automation. We’ll show you the architecture that makes it possible, the governance that makes it trustworthy, and the implementation path that makes it achievable—even if your team has never written a line of code.
The revolution already happened. The only question is whether you’re going to lead it at your firm.
Key Takeaways
- Core Integration Method: LLMs integrate with traditional analytics through API-based architectures that preserve existing quantitative pipelines while adding natural language understanding layers.
- Implementation Timeline: 90-day roadmap from assessment to production deployment, starting with single use case proof-of-concept.
- Architecture Essentials: Four-layer system (existing models → API bridge → semantic layer → intelligence layer) with sub-2-second response times.
- Multi-Agent Approach: Specialized agents for research, analysis, compliance, and communication work together through orchestration protocols.
- ROI Timeline: Initial investment recovers within year one, with significant returns compounding in years two and three.
- Critical Success Factors: Data quality, governance framework, and change management matter more than technical sophistication.
- Future State: By 2026, AI-enhanced analytics becomes table stakes, with 75% of institutions having mature implementations.
The Evolution of Financial Analytics: From Excel to Intelligence
From Manual Models to Machine Intelligence in Financial Analytics
Picture a senior analyst in 2010. It’s 7 AM, and she’s updating her Excel model—300 rows, 50 columns, linked across 12 worksheets. By noon, she’ll have clean charts. By 3 PM, a deck for the investment committee. By 6 PM, exhaustion.
That analyst today? She manages 15,000 variables before her first coffee using quantitative finance AI systems.
The transformation didn’t happen overnight. It happened in waves, each solving the previous era’s breaking point:
| Era | Breaking Point | Solution | New Capability |
| 1990s | Manual calculation errors | Statistical packages | Accuracy at scale |
| 2000s | Structured data only | Python/R platforms | Alternative data integration |
| 2010s | Human pattern recognition limits | Machine learning financial modeling | Invisible correlation detection |
| 2020s | Translation to stakeholders | LLM integration | Automatic financial narrative generation |
Each wave brought a step-function improvement. Statistical packages eliminated calculation errors that cost millions. Python democratized quantitative methods—suddenly, a startup could compete with Goldman Sachs. Machine learning models have demonstrated the ability to detect critical market events hours before traditional methods⁴, such as identifying regime changes in real-time.
But success created a new problem. Modern quantitative models generate probability distributions across 10,000 scenarios. They produce correlation matrices exceeding 1TB daily. They output sensitivity analyses with millions of permutations.
The human brain processes visual information in 13 milliseconds. It can hold seven items in working memory. It makes decisions using stories, not statistics.
The gap between what models produce and what humans need has never been wider—until agentic analytics finance bridged it.
Today’s Data Reality: 80% Untapped by Traditional Portfolio Optimization AI
Your competitors are drowning in the same ocean of data you are. The difference? Some have learned to swim.
Consider the daily data flow at a typical hedge fund:
- 5TB of market data flows through the pipes
- 12TB of alternative data waits to be processed
- 8TB of text—earnings calls, filings, news—remains largely unread
- 20TB of social sentiment data expires worthless
The utilization rates tell the real story:
Market data gets 95% usage—it’s structured, familiar, comfortable. But unstructured text? 15% on a good day. Social sentiment? 8%. That’s not a technology problem. It’s a translation problem.
The firms winning this race aren’t processing more data. They’re understanding it better. They’ve built bridges between quantitative precision and human intuition. When their models detect a 3-sigma deviation, their LLMs explain why it matters: “This pattern preceded the last three corrections. Energy sector rotation suggests institutional repositioning. Consider reducing exposure to growth names.”
MiFID II Reality Check: Regulations now require demonstrating best execution across 70+ factors. Basel III demands stress testing across 5,000+ scenarios. Try explaining that in a PDF.
Firms using integrated analytics report substantial reductions in compliance costs. Not from doing less—from explaining better. When regulators understand your decisions, they trust your process.
The competitive advantage compounds: systematic funds using integrated platforms consistently outperform traditional approaches. Client retention improves significantly when clients receive weekly personalized insights versus quarterly PDFs.
Every firm has access to the same data. The winners are those who transform it into understanding.
Large Language Models: Your Universal Translator
The Breakthrough: Math to Meaning
Traditional model output: “β = 1.34, R² = 0.67, p < 0.001”
LLM-enhanced output: “This tech stock amplifies market moves by 34%—great in bull markets, painful in corrections. Two-thirds of its movement follows the broader market, but the remaining third depends on company-specific news. The pattern is statistically rock-solid.”
Same information. Different impact.
Think of LLMs as bridges between mathematics and business language. They don’t replace your models—they explain them. When trained specifically on financial data, the improvements are dramatic:
| Task | General LLM | Finance-Tuned LLM | Real Impact |
| Earnings sentiment | 71% accurate | 94% accurate | Catches subtle guidance changes |
| Risk identification | 59% accurate | 91% accurate | Flags hidden exposures |
| Regulatory extraction | 64% accurate | 89% accurate | Automates compliance |
| Market regime detection | 52% accurate | 88% accurate | Faster strategy shifts |
The Open Source Benchmark to Measure LLM Accuracy in Financial Retrieval proves this isn’t hype—it’s measurable, reproducible improvement. Finance-tuned models understand that “guidance” means forward-looking statements, that “dovish” describes central bank policy, that “basis points” aren’t typos.
But here’s what makes them revolutionary: LLMs handle what quantitative methods can’t. They detect the shift in tone when a CEO stops saying “confident” and starts saying “optimistic.” They synthesize insights across asset classes, connecting equity volatility to credit spreads to commodity futures. They generate hypotheses your models can test.
They turn correlation into causation, statistics into stories, data into decisions.
Financial NLP: Four Levels of Implementation Maturity
Financial natural language processing follows a maturity curve. Master each level before attempting the next:
Level 1: Sentiment Analysis — Simple but powerful. Scan 10,000 news articles. Flag positive, negative, neutral. Momentum strategies using sentiment signals demonstrate measurable improvements in returns. Your edge: moving faster than human readers ever could.
Level 2: Entity Recognition — The system knows that “Apple” means AAPL, not fruit. It tracks when “Buffett” appears near “selling” and specific ticker symbols. M&A arbitrage opportunities surface faster when you’re monitoring 50,000 sources simultaneously.
Level 3: Document Understanding — This is where LLMs earn their keep. A 300-page 10-K filing becomes a structured analysis of risk factors, accounting changes, and management tone shifts. Due diligence time drops significantly. Nothing gets missed when using financial statement analysis with large language models.
Level 4: Relationship Extraction — The cutting edge. Your system maps connections humans can’t see: supply chain dependencies four layers deep, regulatory changes affecting seemingly unrelated sectors, social sentiment predicting earnings surprises. Event-driven strategies using relationship extraction show notable performance improvements.
Research from “Can Large Language Models Analyze Financial Statements Well?” shows finance-tuned LLMs achieving strong accuracy on ratio calculations—approaching junior analyst capability at 1000x speed.
Each level builds on the last. Start with sentiment. Master it. Then move up. The firms trying to jump straight to Level 4 are the ones complaining that “AI doesn’t work.”
It works. You just need to crawl before you run.
The Integration Framework: Building Your Bridge
The Architecture That Actually Works
Forget the vendor diagrams with 50 boxes and 100 arrows. Real integration architecture is surprisingly simple.
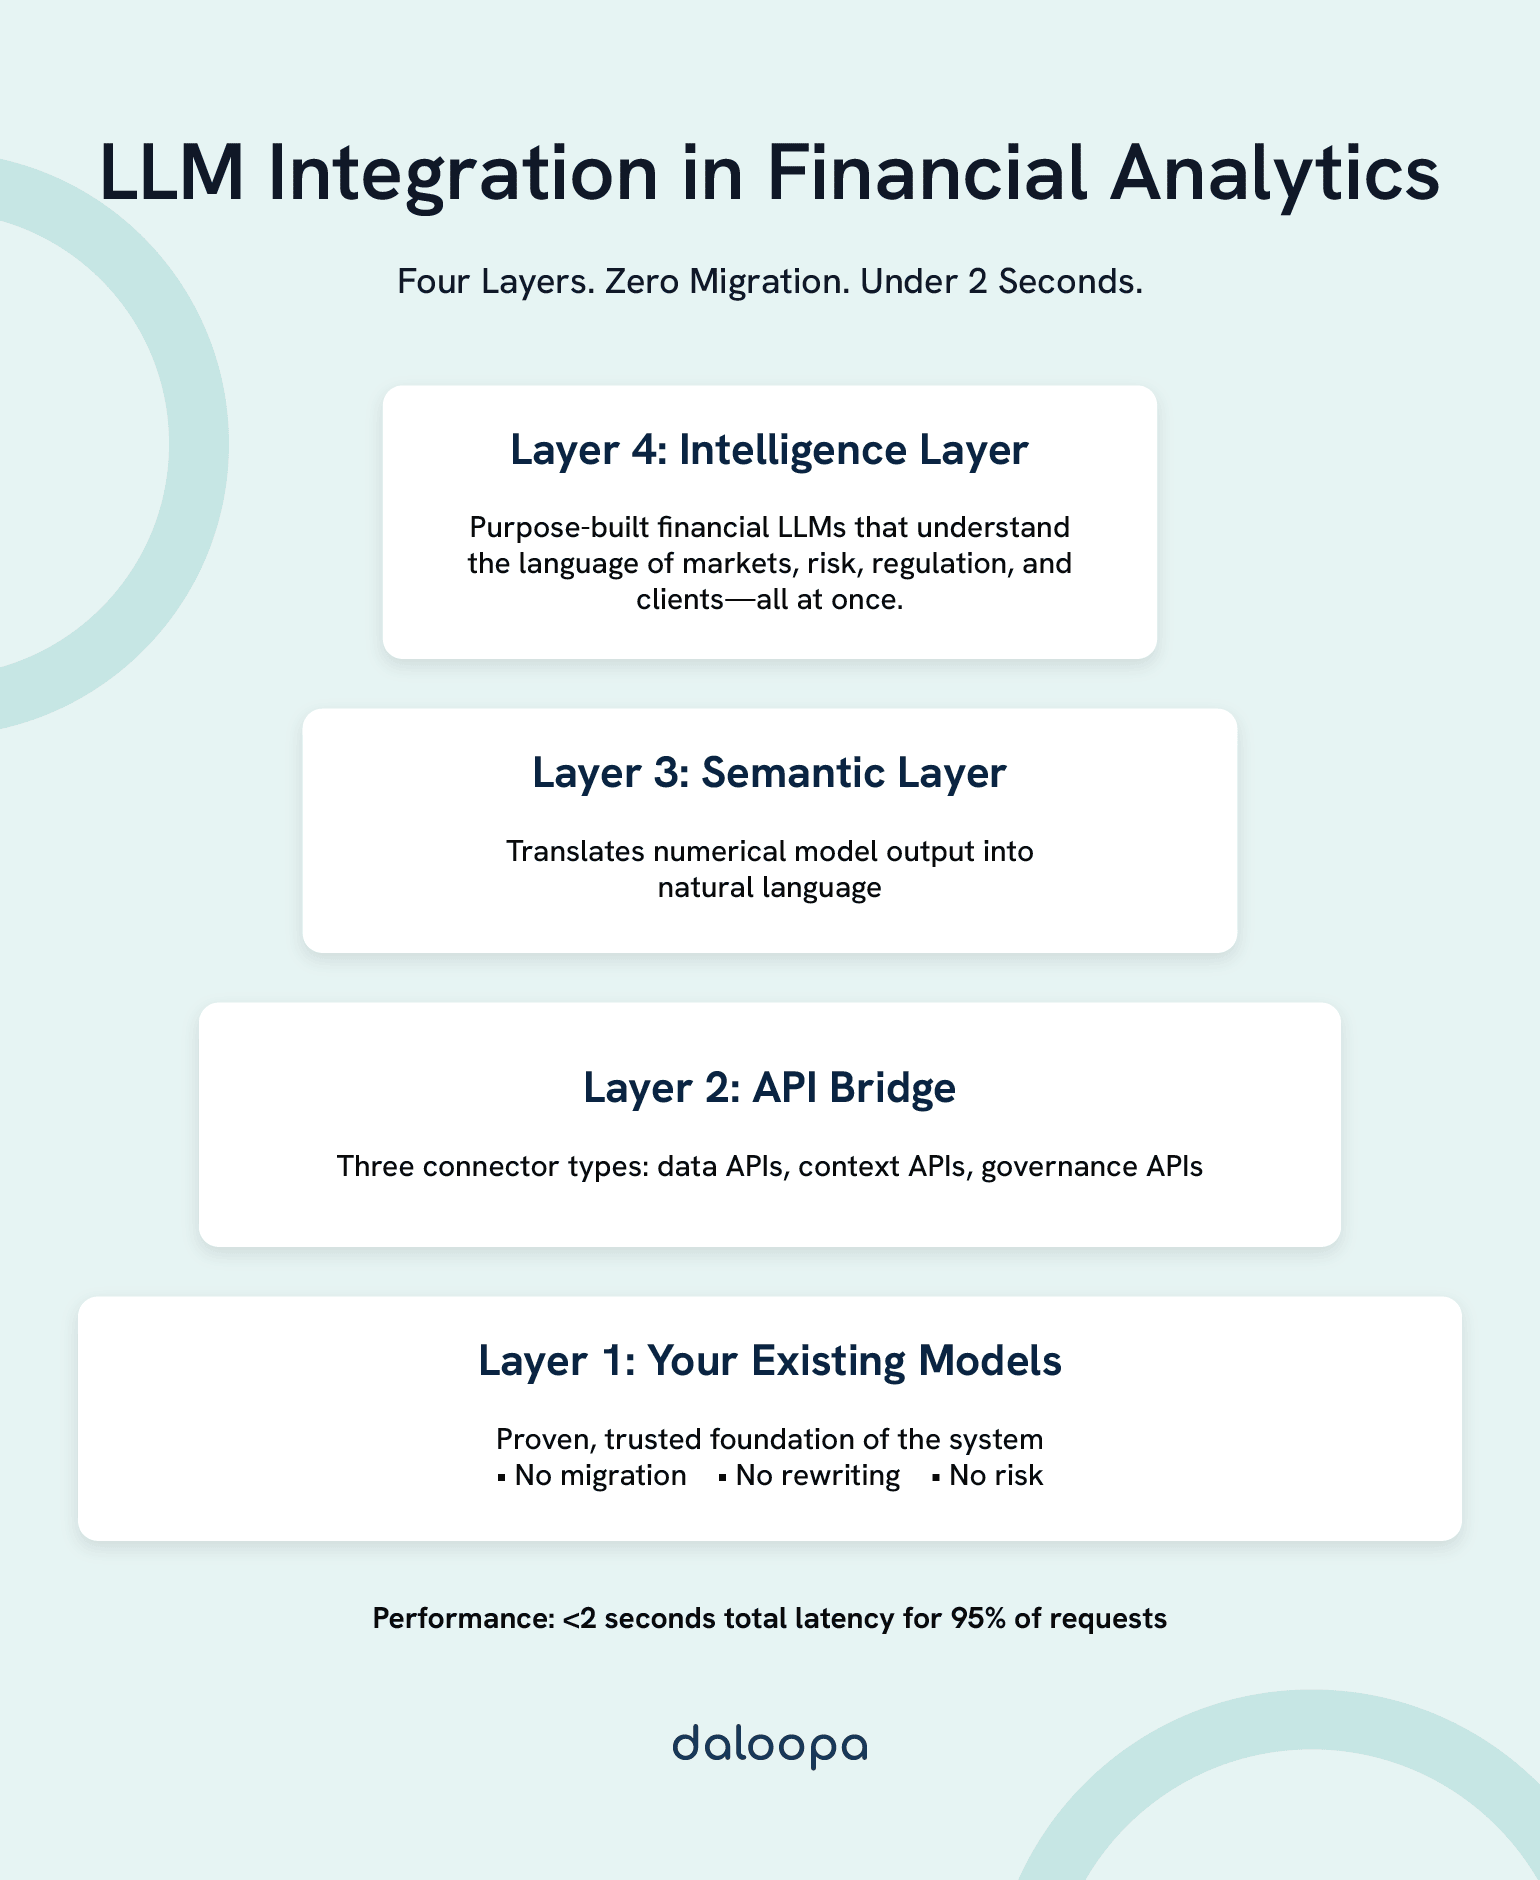
Layer 1: Your Existing Models (Don’t Touch Them) — Your risk models, pricing engines, and portfolio optimizers keep running exactly as they are. No migration. No rewriting. No risk. They’re the foundation—proven, tested, trusted.
Layer 2: The API Bridge — Three types of connectors:
- Data APIs: Stream outputs from your models (JSON/Protocol Buffers)
- Context APIs: Pull market data, positions, client profiles
- Governance APIs: Log decisions, track lineage, ensure compliance
Industry-standard performance benchmarks for financial APIs typically target low latency, high throughput, and robust payload handling.
Layer 3: The Semantic Layer — Your models speak numbers. Your stakeholders speak English. This layer translates:
- Structured outputs → Natural language prompts (50ms)
- LLM responses → Validated, formatted reports (150ms)
- Feedback loops → Model improvements (async)
Layer 4: The Intelligence Layer — Purpose-built financial LLMs that understand:
- Portfolio theory and risk metrics
- Regulatory requirements and reporting standards
- Client preferences and communication styles
- Market dynamics and historical patterns
Total stack latency: <2 seconds for 95% of requests.
Multi-Agent Systems: Divide and Conquer
One LLM trying to do everything fails. Multiple specialized agents working together succeed.
The Research Agent
- Monitors 50,000+ sources continuously
- Identifies patterns, anomalies, opportunities
- Generates hypotheses for testing
- Feeds insights to other agents
The Analysis Agent
- Runs quantitative models
- Performs backtesting
- Calculates risk metrics
- Validates research hypotheses
The Compliance Agent
- Checks every decision against regulations
- Documents reasoning and data sources
- Generates audit trails
- Flags potential violations
The Communication Agent
- Personalizes output for each stakeholder
- Adjusts technical depth
- Maintains consistent narrative
- Ensures brand voice
The Orchestration Layer — Coordinates agents using Model Context Protocol (MCP):
- Route requests to appropriate agents (5ms)
- Manage dependencies and sequencing (10ms)
- Resolve conflicts between outputs (20ms)
- Assemble final deliverables (15ms)
Result: Complex analyses that would take analysts hours, complete in seconds.
Real-World Applications: Theory to Trading Floor
Portfolio Management Revolution
Before Integration: Monday morning. Portfolio manager reviews 200 positions. Manually checks correlations. Reads 20 research reports. Makes 5 adjustments. Time: 4 hours.
After Integration: Monday morning. AI agents have already:
- Analyzed 10,000 possible adjustments overnight
- Generated personalized recommendations for each PM’s style
- Written explanations for each suggestion
- Prepared one-click execution orders
Time: 5 minutes to review and approve.
Leading institutions report that AI tools parsing large datasets can identify hidden market signals⁵, enabling managers to unlock new ways to capture investment alpha. The transformation includes:
- Rebalancing frequency: Monthly → Daily
- Tracking error improvements
- Enhanced alpha generation
- Dramatically increased position capacity
Risk Management Transformation
Traditional VaR report: “95% VaR: $2.3M”
LLM-enhanced risk report: “Your portfolio could lose $2.3M on a bad day (5% chance). The main driver is your tech concentration—specifically, your NVIDIA position accounts for 40% of this risk. The last time we saw similar conditions was February 2020. Consider hedging with QQQ puts or reducing position size by 30%.”
Among bank leaders that have integrated genAI, 88% are seeing gains in risk management and compliance⁶. Measurable improvements include:
- Faster risk identification
- Reduced false positives
- Fewer regulatory issues
- Improved risk report comprehension
Client Service Innovation
One relationship manager, 100 clients, and complete confidence.
The system generates:
- Daily personalized market updates
- Weekly performance summaries
- Monthly strategy reviews
- Quarterly comprehensive reports
Each one different. Each one perfect. Every message hand-crafted.
Gen AI solutions transform tedious manual processes into engaging, efficient interactions⁷, dramatically improving customer service quality. Client metrics show:
- Response time to queries: Hours → Minutes
- Significantly improved client satisfaction
- Higher asset retention rates
- Increased referral rates
Technical Implementation Guide: Your 90-Day Roadmap
Days 1-30: Foundation
Week 1: Assessment
- Catalog existing models and data sources
- Identify highest-impact use case
- Map stakeholder requirements
- Define success metrics
Week 2: Architecture Design
- Design API interfaces
- Select LLM platform (evaluate options with this guide)
- Plan data governance
- Create security framework
Week 3: Prototype Development
- Build proof-of-concept
- Connect one model to LLM
- Generate sample outputs
- Gather initial feedback
Week 4: Refinement
- Tune prompts for accuracy
- Optimize for latency
- Implement basic governance
- Prepare for pilot
Days 31-60: Pilot Phase
Week 5-6: Limited Deployment
- Deploy to 5-10 power users
- Monitor performance metrics
- Collect detailed feedback
- Fix critical issues
Week 7-8: Expansion
- Add second use case
- Increase user base to 25
- Implement feedback loops
- Begin training program
Days 61-90: Scale and Optimize
Week 9-10: Production Readiness
- Complete security audit
- Implement monitoring
- Create disaster recovery plan
- Document everything
Week 11-12: Full Deployment
- Roll out to all users
- Launch training program
- Establish success metrics
- Plan next use cases
Critical Success Factors to Consider
Technical Requirements:
- Sub-2-second response time
- 99.9% uptime
- Complete audit trail
- End-to-end encryption
Organizational Requirements:
- Executive sponsorship
- Dedicated team (3-5 people)
- Clear governance structure
- Continuous training program
Common Pitfalls to Consider:
- Starting too big—prove value with one use case first.
- Ignoring governance—regulators will ask.
- Underestimating change management—people need time.
- Over-promising—manage expectations carefully.
- Under-investing in training—adoption requires understanding.
The Reality Check: Challenges and Strategic Solutions
Technical Hurdles You’ll Face
Data Quality Issues: Your models are only as good as your data. Common problems:
- Inconsistent formats across systems
- Missing historical data
- Conflicting data sources
- Real-time synchronization failures
Solution: Start with your cleanest, most reliable dataset. Build quality filters. Implement validation layers. Perfect one pipeline before adding more.
LLM Limitations: Even the best models struggle with:
- Complex derivatives pricing
- Multi-period optimization
- Non-linear risk calculations
- Extreme tail events
Solution: Keep quantitative models for computation, use LLMs for explanation. Never let LLMs make mathematical decisions—let them explain what your models decide.
Regulatory and Compliance Aspects
The Questions Regulators Will Ask:
- “How do you ensure accuracy?” → Show validation processes
- “What about bias?” → Demonstrate testing procedures
- “Who’s accountable?” → Clear governance structure
- “Can you audit this?” → Complete decision logs
- “What if it fails?” → Robust fallback systems
Documentation Requirements:
- Model architecture diagrams
- Data flow documentation
- Decision trees for agent logic
- Testing and validation reports
- Incident response procedures
MCP documentation provides templates for regulatory compliance.
Human Factors: The Hardest Part
Resistance from Analysts: “It’s going to replace me” → “It makes me 10x more productive” — Show them how integration amplifies their skills rather than replacing them. Deloitte estimates IBD productivity can be improved by 34% with genAI⁸.
Skepticism from PMs: “I don’t trust black boxes” → “Here’s exactly how it works” — Complete transparency in logic and decision-making builds trust.
Adoption Challenges:
- 20% adopt immediately (innovators)
- 60% need proof of value (pragmatists)
- 20% resist until forced (laggards)
Focus on the middle 60%. Show quick wins. Share success stories. Make it easier to use the new system than the old one.
ROI and Performance Metrics: Building the Business Case
Year 1: Investment Phase
Breaking down a typical $100M AUM firm’s costs and returns:
Initial Investment:
- Platform licensing: $500K
- Implementation team: $1.5M
- Training program: $300K
- Infrastructure upgrades: $200K
- Total Year 1 Costs: $2.5M
Immediate Returns: Research shows 68% of respondents believe genAI will increase employee efficiency, and 63% tie the technology to an increase in revenue⁹. Expected returns include:
- Reduction in report generation time
- Improvement in client retention
- Reduction in compliance costs
- Elimination of manual errors
Year 2: Scale and Acceleration
Costs drop. Benefits compound.
Platform licensing remains stable while implementation costs decrease significantly. The optimization phase requires less investment than initial implementation, and advanced training costs less than foundational programs.
Returns multiply as efficiency gains compound, revenue uplift from better insights grows, and client retention improves from enhanced service quality.
Year 3: Competitive Advantage
By year three, the focus shifts from calculating ROI to measuring competitive distance. Leading firms report:
- Substantial multi-year returns
- Improved client satisfaction metrics
- Reduced operational costs
- Enhanced portfolio performance
The firms that waited are now three years behind. The gap is accelerating.
The Future: What’s Coming and When
Next 18 Months: The Near Horizon
Q1 2025:
- Sub-100ms inference becomes standard
- High accuracy on structured data extraction
- Real-time translation across multiple languages
- Regulatory sandbox programs begin
Q3 2025:
- First autonomous trading agents approved for limited deployment
- Quantum-classical hybrid models for portfolio optimization AI
- Brain-computer interfaces enter prototype phase
- Industry-wide AI governance standards published
Q1 2026:
- Natural language becomes primary interface for all trading systems
- Synthetic data generation eliminates backtesting limitations
- Cross-firm AI collaboration protocols established
- “AI trading licenses” proposed by regulators
The Workforce Evolution
New roles emerging require hybrid expertise bridging finance and technology. Financial AI architects combine quantitative knowledge with engineering skills. Prompt engineers optimize LLM interactions for financial contexts. AI risk managers ensure system reliability and compliance. Narrative analysts validate AI-generated content for accuracy and appropriateness.
Traditional roles are transforming rather than disappearing. Analysts become AI supervisors, portfolio managers become strategy orchestrators, risk managers become exception handlers, and compliance officers become rule programmers.
The premium for hybrid skills—finance plus AI—continues to grow. Universities scramble to update curricula. The talent war intensifies.
Institutional Adoption Curve
More than 50% of tech leaders within financial services are interested in exploring AI applications¹⁰, with adoption accelerating rapidly:
2024-2025: Early adopters reap competitive advantages while the rest of the market watches carefully and regulators develop frameworks.
2025-2026: FOMO drives broader implementation as vendor solutions mature and best practices emerge from pros and cons of using LLMs for financial analysis.
2026-2027: AI-enhancement becomes table stakes. Laggards lose market share while new regulations require AI governance.
The question isn’t whether to adopt—it’s about timing your entry.
Your Two-Second Advantage Starts Now
The math is unforgiving. While you read this conclusion, high-frequency traders executed 50,000 trades. Market makers adjusted 10,000 prices. Somewhere, a risk model flagged an anomaly that needs explaining.
Two seconds from now, firms using integrated LLM financial analytics integration will have already understood, explained, and acted on that anomaly. Their stakeholders will have personalized insights. Their compliance will be documented. Their edge will have compounded.
The integration of LLMs with traditional financial analytics isn’t just another technology upgrade—it’s the bridge between mathematical truth and human understanding. Through API architectures that preserve quantitative rigor, semantic layers that translate complexity, and feedback loops that continuously improve, we’ve solved finance’s fundamental challenge: making complexity actionable at the speed of modern markets.
The transformation goes beyond metrics. It’s about capability—the ability to explain complex stress tests in plain English, personalize insights for thousands of clients simultaneously, and turn correlation into narrative through agentic analytics finance.
Success requires more than deploying technology. It demands architecture that balances speed with accuracy—sub-2-second responses without sacrificing precision. Governance that satisfies regulators while enabling innovation. Change management that transforms skeptics into champions.
The investment seems substantial until you calculate the cost of not investing. Every day you wait, competitors pull further ahead. Clients expect more. Regulators demand better. Markets move faster.
But here’s what the vendors won’t tell you: start small. One use case. One team. One success. Build credibility. Demonstrate value. Then scale. The firms trying to transform everything simultaneously are the ones writing cautionary tales. The firms transforming incrementally are writing success stories.
The future of finance isn’t about choosing between quantitative models and linguistic intelligence. It’s about combining them. Your models provide precision. LLMs provide comprehension. Together, they provide something unprecedented: the ability to understand, explain, and act on complexity in real-time.
The revolution already happened. Markets are already being analyzed, explained, and traded by integrated systems. The only question remaining is whether your firm will be using these systems or losing to them.
The next step is yours.
Explore how Daloopa’s LLM integration capabilities enable financial institutions to bridge the gap between computation and comprehension. See how the Model Context Protocol (MCP) provides the architecture for seamless integration. Discover how leading firms are already transforming their analytics with Daloopa API.
The two-second advantage is waiting. The only thing standing between you and transformation is the decision to begin.
Start today. Lead tomorrow. Or watch others do both.
References
- Boston Consulting Group. “Global Asset Management Industry Hit New Record High in 2024—and a Critical Turning Point.” BCG Press Release, 29 Apr. 2025.
- Daloopa. “Financial Analysts Guide to Choosing the Right LLM for Data Analysis.” Daloopa Blog, 13 Aug. 2024.
- Deloitte Center for Financial Services. “Harnessing Gen AI in Financial Services: Why Pioneers Lead the Way.” Deloitte Insights, 26 Feb. 2025.
- Chen, Jun, and Edward P.K. Tsang. “Detecting Regime Change in Computational Finance: Data Science, Machine Learning and Algorithmic Trading.” Taylor & Francis, 2020.
- McKinsey & Company. “Unlocking Value from Technology and AI for Institutional Investors.” McKinsey Insights, 21 Jan. 2025.
- PR Newswire. “Cashing in: Study shows banks investing big in GenAI, and it’s paying off.” PR Newswire SAS News, 28 Oct. 2024.
- McKinsey & Company. “Capturing the Full Value of Generative AI in Banking.” McKinsey Insights, 5 Dec. 2023.
- Deloitte Center for Financial Services. “AI in Investment Banking.” Deloitte Insights, 27 Jul. 2023.
- PwC. “Leveraging GenAI in Banking.” PwC Publications, 1 Oct. 2024.
- Wolters Kluwer. “For Financial Institutions, Generative AI Integration Starts Now.” Expert Insights, 1 Nov. 2024.


