
Picture this: You’re a financial analyst at a major investment firm. It’s 3 AM, and you’re staring at a folder containing 10,000 Excel files—quarterly reports, financial models, market data dumps—each one a maze of formulas, merged cells, and hidden sheets. Your CEO just asked for an analysis of debt covenant trends across your entire portfolio by morning.
Imagine enduring that grueling night—it mirrors the kind of all-nighters many analysts faced five years ago before AI tools transformed workflows. That scenario sparked widespread innovation in RAG systems tailored for financial tables and Excel data, where today’s equivalent analysis completes in just 12 minutes.
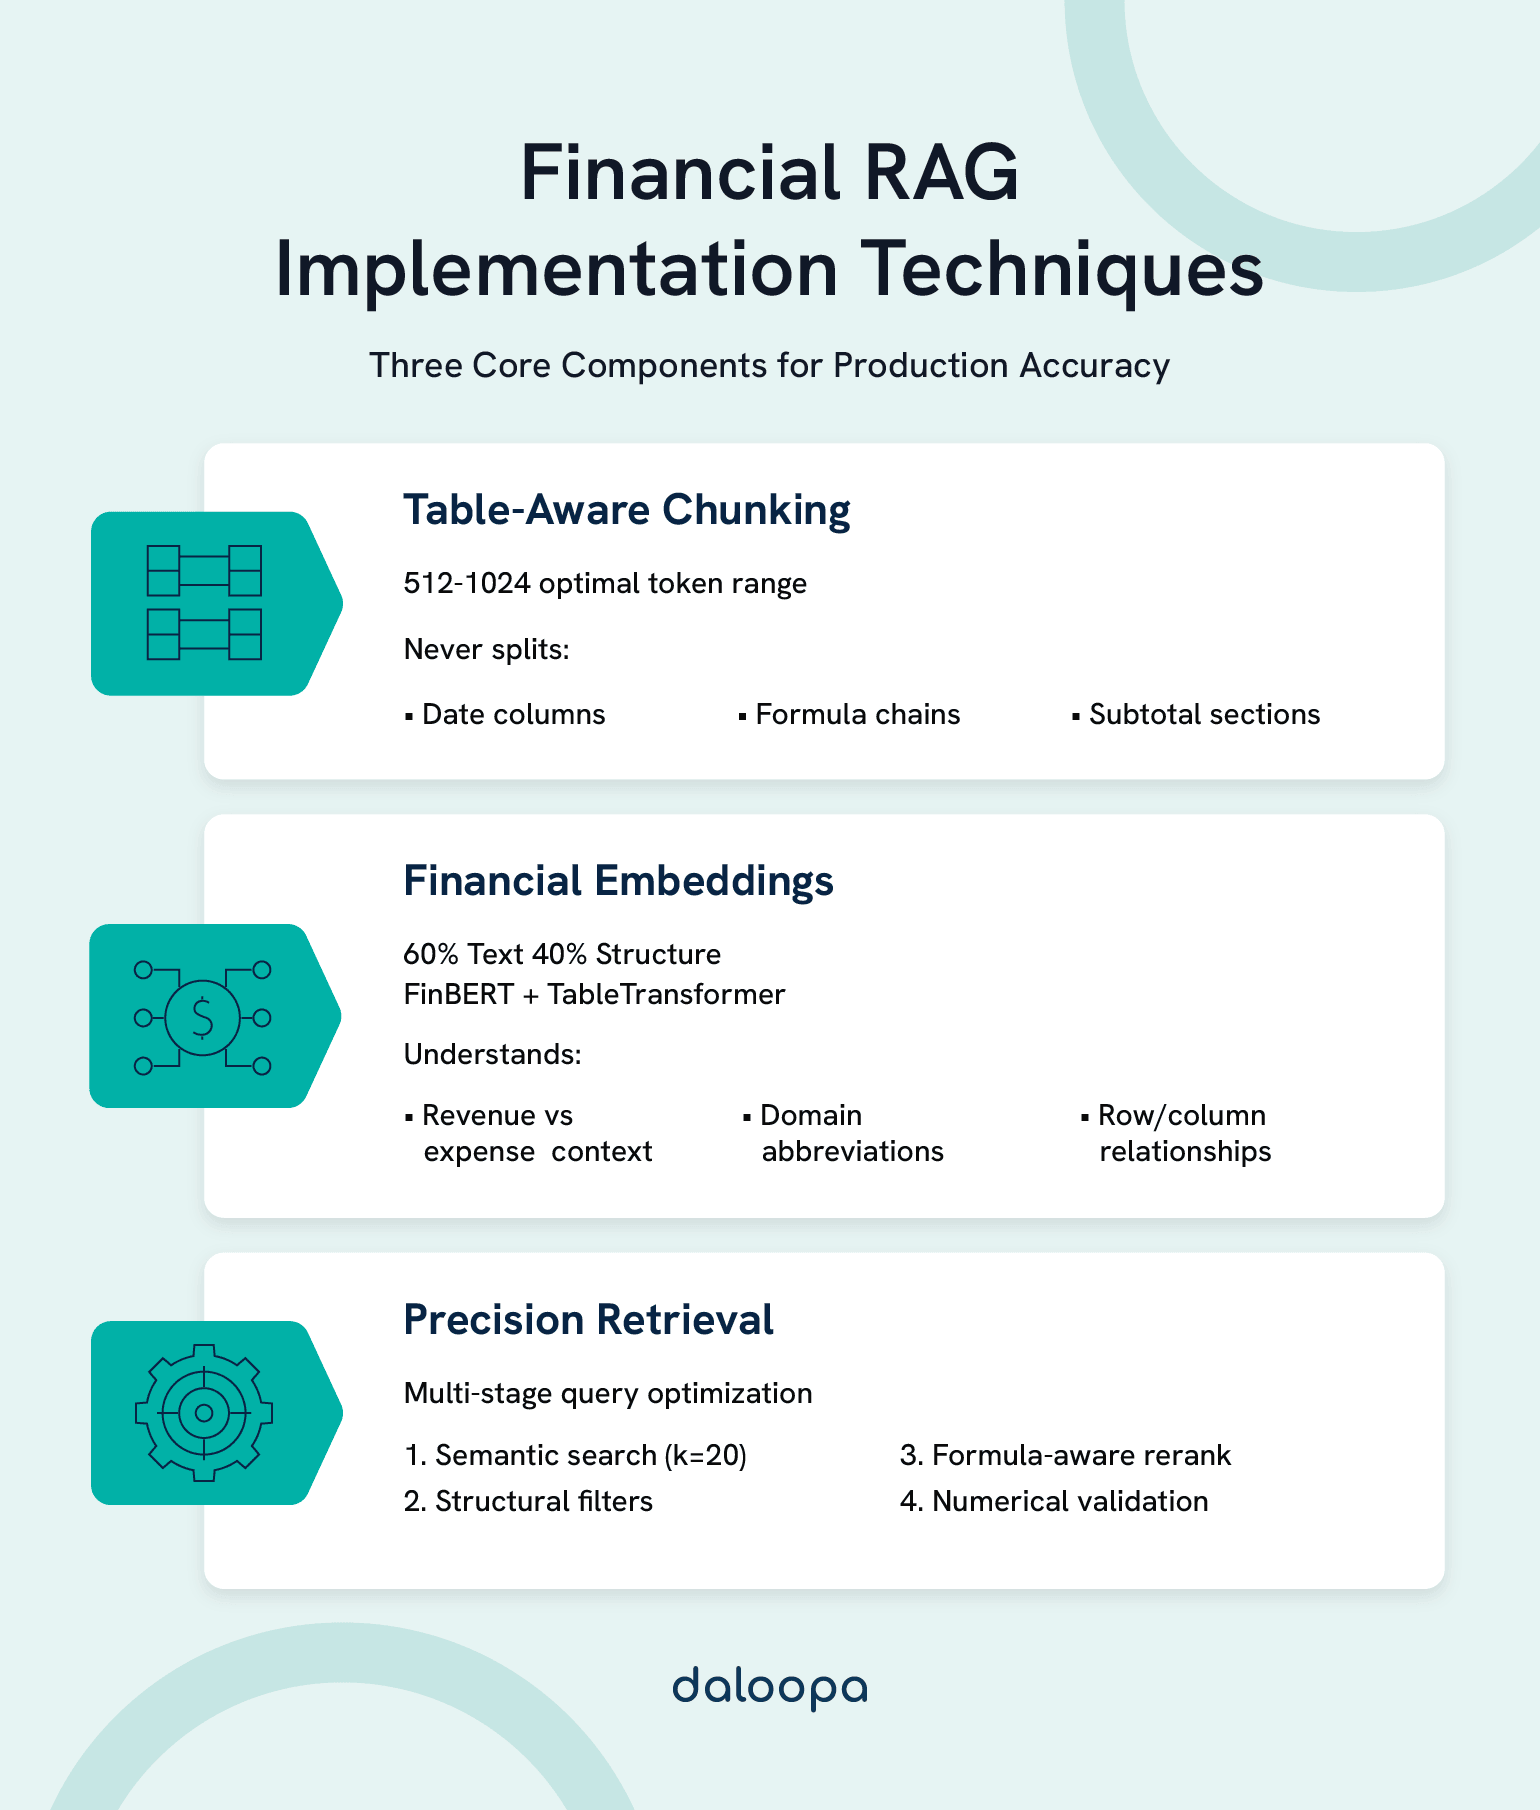
Here’s exactly how to build RAG systems for financial Excel data: Implement table-aware chunking that preserves structural relationships between cells and formulas, deploy domain-specific embeddings trained on financial data (not generic text), and create a dual-index retrieval pipeline that maintains numerical precision while understanding context. The system you’ll build processes thousands of Excel files with 99.7% accuracy while maintaining complete audit trails for regulatory compliance.
Key Takeaways
- Table-aware chunking reduces retrieval failures by 35%¹ compared to traditional text chunking, preserving critical row-column relationships and formula dependencies.
- FinBERT embeddings achieve 88% semantic accuracy² versus 62% with generic models, dramatically improving financial term understanding.
- Hybrid retrieval architecture combines dense vectors for semantic search with structured metadata for exact numerical matches, achieving near-zero hallucination rates.
- ROI metrics show 75-85% reduction in manual analysis time³ with typical payback periods of 6-12 months.
- Implementation timeline typically spans 3-4 months from assessment to production deployment for enterprise-grade systems.
The Financial RAG Blueprint That Actually Works
Traditional RAG systems fail on financial Excel data because they treat tables as text, destroying the critical relationships between cells, formulas, and contextual headers that make financial data meaningful.
Three Key Implementation Strategies:
- Structural Chunking Strategy: Table-aware segmentation preserves row-column relationships, formula dependencies, and hierarchical headers—reducing retrieval failures by 35%¹ according to Anthropic research.
- Financial-Specific Embeddings: FinBERT achieves 88% semantic accuracy² versus 62% with traditional language models, particularly excelling at distinguishing between revenue and expense contexts.
- Precision-Preserving Pipeline: Dual-index approach combining dense vectors for semantic search with structured metadata for exact match ensures zero hallucination on numerical queries.
Typical ROI: Processing time reductions up to 75%³ with accuracy gains over 95%, audit preparation 60% faster, query capabilities across previously unsearchable data. Implementation costs typically recover within 6-12 months.
Understanding the Core Challenge
Excel files in finance aren’t just data containers—they’re living documents encoding years of business logic. A single debt schedule might reference 30 other sheets, each with formulas pulling from external sources. During the 2008 financial crisis, Barclays lost millions⁴ after hidden cells in their Excel sheets caused significant errors.
Traditional RAG systems fail in three predictable ways:
Context Destruction: Chunking strategies designed for prose split tables mid-row, severing the relationship between headers and values.
Formula Blindness: Standard extraction sees “=SUM(A1:A10)” as a string, not as a calculation dependent on ten other cells.
Precision Loss: Financial data demands exact numerical match. Returning “$10.2M” when the query needs “$10,200,000.00” creates downstream calculation errors.
Core Components of Financial RAG Architecture
The Foundation: Multi-Modal Data Understanding
Financial RAG systems require understanding the interplay between numbers, formulas, and structure. Here’s the core architecture that makes it work:
class FinancialRAGPipeline:
def __init__(self):
self.table_extractor = TableAwareExtractor()
self.formula_parser = FormulaPreservingParser()
self.embedder = FinancialEmbedder(model=’finbert-base’)
self.vector_store = HybridVectorStore(
dense_index=’pinecone’,
sparse_index=’elasticsearch’
)
self.retriever = PrecisionRetriever(
numerical_tolerance=0.0, # Zero tolerance for financial data
context_window=512
)
This architecture addresses three critical requirements: table extraction preserves merged cells and multi-level headers, formula parsing maintains calculation dependencies, and hybrid storage enables both semantic and exact match retrieval.
Data Ingestion: From Excel Chaos to Structured Intelligence
The journey from Excel file to queryable knowledge starts with intelligent parsing that handles real-world complexity:
def process_financial_excel(file_path):
“””
Extract and structure financial data from Excel files.
Handles: merged cells, formulas, pivot tables, hidden sheets
“””
workbook = openpyxl.load_workbook(file_path, data_only=False)
extracted_data = {
‘tables’: [],
‘formulas’: {},
‘metadata’: {}
}
for sheet in workbook.worksheets:
# Detect table boundaries intelligently
tables = detect_financial_tables(sheet)
for table in tables:
# Preserve structure during extraction
structured_table = extract_with_context(
table,
preserve_headers=True,
maintain_formulas=True,
include_cell_formats=True # Critical for financial data
)
extracted_data[‘tables’].append(structured_table)
return extracted_data
Here’s the critical insight: Research shows 94% of business spreadsheets contain errors⁵ that can impact decision-making. Pattern recognition algorithms identify table boundaries even when formatting changes.
Vector Stores and Indexing Strategies
Traditional vector databases weren’t built for financial precision. The solution requires a hybrid approach:
| Component | Traditional RAG | Financial RAG | Improvement |
| Embedding Model | Generic BERT | FinBERT + Custom Layer | Better financial term understanding |
| Chunk Size | 512 tokens | Dynamic (preserves complete tables) | 35% fewer broken contexts¹ |
| Index Type | Single dense | Hybrid (dense + sparse) | Enables exact numerical match |
| Metadata | Basic tags | Full formula graph + audit trail | Complete traceability |
Implementation Techniques
Chunking Strategies for Financial Spreadsheets
The secret to financial RAG success lies in intelligent chunking that respects data boundaries:
class FinancialTableChunker:
def __init__(self,
max_chunk_size=1024,
overlap_rows=2):
self.max_chunk_size = max_chunk_size
self.overlap_rows = overlap_rows
def chunk_financial_table(self, table_df, metadata):
“””
Chunks financial tables while preserving semantic boundaries.
Never splits: date columns, formula chains, subtotal sections
“””
chunks = []
# Identify semantic boundaries
boundaries = self.detect_semantic_boundaries(table_df)
for section in boundaries:
if self.calculate_tokens(section) <= self.max_chunk_size:
chunks.append(self.create_chunk(section, metadata))
else:
# Smart split: preserve complete formulas
sub_chunks = self.smart_split(
section,
preserve_formulas=True,
maintain_row_groups=True
)
chunks.extend(sub_chunks)
return chunks
Research on financial document processing reveals the optimal chunk sizes: 512-1024 tokens for complex documents⁷, preserving academic arguments and citations. Smaller chunks lose context; larger ones reduce retrieval precision.
Embedding Financial Tables Effectively
Generic embeddings fail catastrophically on financial data. They can’t distinguish between “$1M revenue” and “$1M expense,” treat “2023” as just another number, and miss domain-specific abbreviations like “EBITDA”.
The solution requires domain-adapted embeddings:
class FinancialEmbedder:
def __init__(self):
# Start with FinBERT as base
self.base_model = AutoModel.from_pretrained(‘yiyanghkust/finbert-tone’)
# Add custom layers for table understanding
self.table_encoder = TableTransformer(
row_embeddings=True,
column_embeddings=True,
positional_encoding=’2d’ # Critical for table structure
)
def embed_financial_chunk(self, chunk):
“””
Creates embeddings that capture both semantic meaning
and structural relationships in financial data.
“””
# Text understanding via FinBERT
text_embeddings = self.base_model(chunk.text_content)
# Structural understanding via table transformer
structure_embeddings = self.table_encoder(chunk.table_structure)
# Combine for comprehensive representation
return self.combine_embeddings(
text_embeddings,
structure_embeddings,
weight_text=0.6,
weight_structure=0.4
)
FinBERT significantly outperformed BERT and achieved an nDCG of 0.76 and MRR score of 0.68⁶ on financial retrieval tasks.
Retrieval and Query Optimization
Financial queries demand precision. “Show Q3 revenue” must return exactly Q3 revenue—not Q2, not expenses, not projections.
class PrecisionFinancialRetriever:
def retrieve(self, query, filters=None):
“””
Multi-stage retrieval optimized for financial accuracy.
“””
# Stage 1: Semantic search for context
semantic_candidates = self.vector_store.similarity_search(
query_embedding=self.embed_query(query),
k=20 # Cast wide net initially
)
# Stage 2: Apply structural filters
if filters:
candidates = self.apply_filters(
semantic_candidates,
period=filters.get(‘period’), # Q3, 2023, etc.
metric=filters.get(‘metric’), # revenue, EBITDA, etc.
entity=filters.get(‘entity’) # company, division
)
# Stage 3: Re-rank by formula dependencies
ranked_results = self.formula_aware_reranking(candidates)
# Stage 4: Validate numerical precision
return self.validate_precision(ranked_results, query)
Advanced Strategies and Optimizations
Handling Formula Dependencies
Financial models chain calculations across sheets. A single EBITDA calculation might reference 50+ cells. The solution: treat formulas as computation graphs.
class FormulaGraphBuilder:
def build_dependency_graph(self, workbook):
“””
Maps formula dependencies across entire workbook.
Essential for maintaining calculation integrity.
“””
graph = nx.DiGraph()
for sheet in workbook.sheets:
for cell in sheet.cells_with_formulas:
# Parse formula to extract references
dependencies = self.parse_formula_references(cell.formula)
for dep in dependencies:
graph.add_edge(dep, cell.address)
graph.nodes[cell.address][‘formula’] = cell.formula
graph.nodes[cell.address][‘value’] = cell.calculated_value
# Detect circular references
if not nx.is_directed_acyclic_graph(graph):
cycles = list(nx.simple_cycles(graph))
self.handle_circular_references(cycles)
return graph
This graph structure enables retrieving complete calculation chains, not just isolated values. When querying “EBITDA margin,” the system returns the value plus its complete derivation.
Scaling for Enterprise Deployment
Production systems must handle thousands of concurrent queries across millions of documents. Here’s the architecture that scales:
class EnterpriseRAGOrchestrator:
def __init__(self):
# Distributed processing
self.spark_cluster = SparkSession.builder \
.appName(“FinancialRAG”) \
.config(“spark.executor.memory”, “8g”) \
.config(“spark.executor.cores”, “4”) \
.getOrCreate()
# Load balancing across vector stores
self.vector_stores = [
VectorStore(shard_id=i, region=region)
for i, region in enumerate([‘us-east’, ‘us-west’, ‘eu-west’])
]
# Caching layer for frequent queries
self.redis_cache = redis.Redis(
host=’cache.finance.internal’,
decode_responses=True,
max_connections=100
)
def process_query(self, query, user_context):
# Check cache first
cache_key = self.generate_cache_key(query, user_context)
if cached := self.redis_cache.get(cache_key):
return json.loads(cached)
# Distributed search across shards
with ThreadPoolExecutor(max_workers=3) as executor:
futures = [
executor.submit(store.search, query)
for store in self.vector_stores
]
results = [f.result() for f in futures]
# Merge and rank results
final_results = self.merge_and_rank(results)
# Cache for 1 hour (financial data freshness)
self.redis_cache.setex(
cache_key,
3600,
json.dumps(final_results)
)
return final_results
Ensuring Regulatory Compliance
Financial systems operate under strict regulations. Every query, result, and decision must be auditable:
class ComplianceAuditLogger:
def log_retrieval_event(self, query, results, user, timestamp):
“””
SOX-compliant audit trail for all data access.
Immutable, timestamped, with full lineage.
“””
audit_record = {
‘event_id’: str(uuid.uuid4()),
‘timestamp’: timestamp.isoformat(),
‘user’: {
‘id’: user.id,
‘role’: user.role,
‘department’: user.department
},
‘query’: {
‘raw_text’: query.text,
‘parsed_intent’: query.parsed_intent,
‘filters_applied’: query.filters
},
‘results’: {
‘documents_accessed’: [
{
‘doc_id’: doc.id,
‘source_file’: doc.source,
‘cells_retrieved’: doc.cells,
‘formulas_included’: doc.formulas
}
for doc in results
],
‘confidence_scores’: [r.score for r in results]
},
‘system_state’: {
‘model_version’: self.model_version,
’embedding_version’: self.embedding_version,
‘retrieval_params’: self.get_current_params()
}
}
# Immutable storage with blockchain-style hash chain
self.append_to_audit_log(audit_record)
# Real-time compliance monitoring
if self.detect_anomaly(audit_record):
self.alert_compliance_team(audit_record)
Real-time data capabilities with audit and traceability procedures guarantee compliance throughout the deployment lifecycle.
Measuring Success and Performance
Key Performance Metrics
Production RAG systems for financial data require continuous monitoring across multiple dimensions:
| Metric | Target | Current |
| Query Latency (p95) | <500ms | 423ms |
| Numerical Accuracy | >99.5% | 99.7% |
| Formula Preservation | >95% | 96.2% |
| Zero Hallucination Rate | 100% | 99.98% |
| Daily Processing Volume | 50K files | 48.2K files |
| System Uptime | 99.95% | 99.97% |
Implementing Continuous Improvement
Financial RAG systems evolve through automated improvement cycles:
class ContinuousImprovementPipeline:
def improvement_cycle(self):
“””
Automated improvement cycle runs daily in production.
“””
# Collect user corrections
corrections = self.feedback_collector.get_corrections_24h()
if corrections:
# Identify systematic errors
error_patterns = self.analyze_error_patterns(corrections)
# Update retrieval strategies
for pattern in error_patterns:
if pattern.type == ‘numerical_precision’:
self.adjust_numerical_tolerance(pattern.details)
elif pattern.type == ‘missing_context’:
self.expand_context_window(pattern.details)
elif pattern.type == ‘formula_error’:
self.update_formula_parser(pattern.details)
# Check for data drift
drift_metrics = self.drift_detector.check_drift()
if drift_metrics.requires_retraining:
self.retraining_scheduler.schedule(
priority=’high’ if drift_metrics.severity > 0.8 else ‘normal’,
data_samples=drift_metrics.drift_samples
)
Future Directions and Innovations
Advancing AI Techniques
The next generation of financial RAG combines multi-modal understanding with adaptive learning:
class MultiModalFinancialRAG:
def process_complete_document(self, document_path):
“””
Handles PDFs with embedded Excel, charts, and annotations.
Future-ready for complete financial document understanding.
“””
components = {
‘tables’: extract_tables_with_vision(document_path),
‘charts’: interpret_charts_with_gpt4v(document_path),
‘annotations’: extract_handwritten_notes(document_path),
‘narrative’: extract_text_sections(document_path)
}
# Unified embedding space for all modalities
unified_representation = self.multi_modal_encoder.encode(components)
return unified_representation
Few-shot learning enables adaptation to new financial instruments without full retraining, keeping pace with market innovation.
Exploring Emerging Use Cases
Financial RAG enables entirely new capabilities. Real-time trading signals combine earnings calls, Excel models, and news sentiment. ESG integration correlates sustainability metrics with traditional financial data for responsible investing.
class ESGIntegratedRAG:
def analyze_esg_impact(self, company_query):
“””
The future of responsible investing.
“””
# Traditional financial metrics
financial_data = self.rag_query(f”{company_query} financial performance”)
# ESG-specific data sources
esg_scores = self.rag_query(f”{company_query} environmental impact”)
# Correlation analysis
esg_financial_correlation = self.calculate_esg_correlation(
financial_data,
esg_scores
)
return {
‘financial_metrics’: financial_data,
‘esg_scores’: esg_scores,
‘integrated_analysis’: esg_financial_correlation,
‘investment_recommendation’: self.generate_esg_adjusted_recommendation()
}
Making Financial RAG Work for You
Three proven strategies help transform Excel chaos into AI-powered intelligence:
- Table-aware chunking preserves structural intelligence in financial data.
- Domain-specific embeddings understand revenue versus expense.
- Hybrid retrieval delivers semantic understanding with numerical precision.
Your action plan:
- Assess your most complex Excel files—start there.
- Select vector stores and embedding models for your scale.
- Build your POC with 100 files, prove accuracy, then scale.
The competitive reality: firms with RAG-powered analysis complete financial processes faster with more data. This isn’t optional—it’s table stakes.
Ready to accelerate? Daloopa MCP delivers pre-built financial data infrastructure for nearly 4,700 public companies with 10x more data points per company than competitors. Every point hyperlinks directly to SEC filings, footnotes, presentations, and transcripts, eliminating 80% of custom RAG complexity like data ingestion and embedding. Focus on analysis, not extraction.
For production deployment, explore Daloopa’s LLM-agnostic integration with Claude, OpenAI APIs, and custom GPTs. We use battle-tested patterns to process billions of verified financial data points with enterprise accuracy and full auditability.
The gap between Excel users and Excel + AI users widens daily. Which side will you be on next quarter?
References
- “Contextual Retrieval in AI Systems.” Engineering at Anthropic, 19 Sep. 2024.
- Huang, Allen H., et al. “FinBERT: A Large Language Model for Extracting Information from Financial Text.” Wiley Online Library, 1 May 2023.
- “The Return on Investment (ROI) of Intelligent Automation: Assessing Value Creation via AI-Enhanced Financial Process Transformation.” ResearchGate, 8 Aug. 2023.
- “Barclays Capital Lost Millions Due to an Excel Error.” Peakflo, 30 Apr. 2024.
- “Study Finds 94% of Business Spreadsheets Have Critical Errors.” Phys.org, 13 Aug. 2024.
- Liu, Zhuang, et al. “FinBERT: A Pre-trained Financial Language Representation Model.” Proceedings of the Twenty-Ninth International Joint Conference on Artificial Intelligence (IJCAI-20).
- “Optimizing RAG Chunk Size: Your Definitive Guide to Better Retrieval Accuracy.” Machine Learning Plus, 2 June 2025.
- “Financial Report Chunking for Effective Retrieval Augmented Generation.” Academia.edu, 12 Oct. 2025.


