
The Excel file sitting on your desktop contains 75,000 tokens worth of financial data. At typical enterprise LLM pricing of $20-30 per million input tokens, that’s $1.50-2.25 every time you analyze your quarterly earnings spreadsheet. Run a thousand analyses monthly, and you’re staring at a $1,500-2,250 bill for what Excel used to do for free.
SpreadsheetLLM breaks this economic stranglehold. Through three engineering innovations: structural-anchor compression, inverted-index translation, and format-aware aggregation, it compresses spreadsheet tokens by 96%¹ while pushing accuracy from baseline performance to 78.9% F1 score¹. Your $2,250 monthly bill becomes $90, and your error rate drops significantly.
This isn’t theoretical. Investment firms processing dozens of financial statements daily are implementing these techniques to make LLM financial spreadsheet analysis economically viable at enterprise scale.
Key Takeaways
- 96% Token Reduction: SpreadsheetLLM’s SheetCompressor framework reduces token usage by 96%², transforming 125,000 tokens into just 5,000.
- Superior Accuracy: Achieves 79% F1 score, a 13% improvement over previous state-of-the-art³.
- Three-Module Architecture: Structural anchors, inverted-index translation, and format-aware aggregation work together for optimal compression.
- Dramatic Cost Savings: Reduces analysis costs from $2,250 to $90 monthly for typical enterprise usage.
- Immediate Implementation: Available through Daloopa’s API for turnkey deployment without building compression infrastructure.
Why Traditional LLMs Fail at Financial Spreadsheet Analysis
The Intersection of LLMs and Structured Financial Data
Picture a standard 10-K filing on your screen. Thirty interconnected tables. Four thousand formulas. Merged cells creating visual hierarchies that make perfect sense to you but look like chaos to standard LLMs.
The language model sees every cell as a discrete text chunk requiring positional encoding. Your balance sheet’s elegant structure becomes a stream of 125,000 tokens. The model consumes tokens for empty cells, formatting codes, and redundant headers – digital static drowning out the signal.
Traditional approaches tried brute force: dump everything into context and hope the model figures it out. Open-source models like Llama3 and Mistral-v2 showed F1 scores of approximately 72%⁴ for basic table identification. Complex queries fail entirely, e.g. “calculate debt-to-equity across all subsidiaries” returns errors or nonsense.
| Analysis Type | Traditional LLM | SpreadsheetLLM | Token Difference |
| Balance Sheet Analysis | 45,000 tokens | 1,800 tokens | -96% |
| Multi-Quarter Comparison | 180,000 tokens | 7,200 tokens | -96% |
| Subsidiary Consolidation | 275,000 tokens | 11,000 tokens | -96% |
Understanding why LLMs struggle with spreadsheets requires examining the fundamental mismatch between how humans and machines parse structured data.
Understanding the Financial Spreadsheet Ecosystem
Open any institutional investment model. You’ll find fifteen linked worksheets, each containing twenty tables with inconsistent formatting. Some use merged cells for headers. Others embed formulas referencing external workbooks. A few contain pivot tables summarizing data that lives elsewhere.
The sparse data problem compounds this complexity. When fewer than 33% of cells contain data, systems become significantly less memory efficient⁵ and financial spreadsheets often exceed this sparsity threshold. Those blanks carry meaning. An empty cell in historical data means “no transaction.” An empty cell in projections means “pending calculation.” LLMs can’t infer this distinction without consuming tokens to analyze context.
What specifically breaks traditional LLM comprehension:
- Merged cell headers creating visual hierarchies the model can’t parse
- Implicit relationships between non-adjacent tables
- Format-dependent meaning where bold indicates subtotals
- Calculated fields that reference cells by position, not content
- Hidden columns containing intermediate calculations
Standard tokenization treats each cell independently, destroying these relationships. A simple SUM formula spanning twenty cells generates forty tokens: twenty for values, twenty for positions. The semantic meaning vanishes in translation.
These complexities translate directly into token inefficiency and degraded accuracy.
The Hidden Cost of Token Inefficiency
The math is brutal. A typical earnings workbook contains 10,000 populated cells across 30 tables. Using a Markdown-like style representation where row and column indices are represented¹ creates substantial token overhead.
The Traditional Cost Formula: [10,000 cells] × [2 tokens per cell] × [$30 per million input tokens] = $0.60 per analysis
Reasonable for one document. Catastrophic at scale.
A hedge fund analyzing 500 earnings reports during quarterly season faces:
- 10 million tokens processed
- $300 in API costs
- 45 hours of processing time
- Significant error rates on complex queries
The induced latency kills real-time analysis. An analyst waiting 90 seconds for each query answer loses their analytical flow. They revert to manual Excel work, defeating the entire purpose.
But token count is only part of the problem. Context windows overflow. While leading enterprise LLMs offer 128K-200K token context windows, even these expanded limits mean massive spreadsheets still require splitting across multiple calls, losing cross-table relationships. Each split multiplies error rates.
SpreadsheetLLM’s architecture becomes transformative here – not through marginal improvements, but by fundamentally reimagining how spreadsheets become language.
How SpreadsheetLLM Achieves 96% Token Reduction
The SheetCompressor Framework: Three Key Innovations
Think of SheetCompressor like ZIP compression for spreadsheet structure, but instead of reducing file size, it reduces semantic redundancy while preserving analytical meaning.
The framework operates through three portable modules: structural-anchor-based compression, inverse index translation, and data-format-aware aggregation¹.
Structural Anchors identify immutable reference points. Column headers like “Q3 2024 Revenue” become single tokens that represent entire data ranges. When the model sees this anchor, it understands every cell below contains Q3 revenue data without encoding each position individually.
Before: [A1:”Q3 2024 Revenue”, A2:1000000, A3:1250000, A4:1500000…]
After: [ANCHOR_Q3_REV:[1000000, 1250000, 1500000…]]
This method filters out 75% of spreadsheet content but preserves 97% of rows¹.
Inverted-Index Translation creates hash maps where one reference represents entire patterns. Formulas like =SUM(B2:B50) appearing across multiple sheets become single tokens pointing to pre-computed results.
Before: 50 separate formula tokens across sheets After: 1 token with indexed results
Format-Aware Aggregation groups cells by semantic purpose. All currency cells displaying millions get one token. All percentage cells showing margins get another. The model learns that [CUR_M:15.2, 18.7, 22.1] means millions in revenue, not just random numbers.
| Compression Technique | Token Reduction | Accuracy Impact | Processing Speed |
| Structural Anchors | 75% | +8% | 3x faster |
| Inverted Index | Significant | +12% | 5x faster |
| Format Aggregation | Substantial | +7% | 2x faster |
| Combined Effect | 96% ² | +25.6% ⁶ | 10x faster |
For production deployment, Daloopa’s API provides pre-built compression pipelines that handle these transformations automatically, eliminating the need to build compression infrastructure from scratch.
Compression alone isn’t enough without intelligent boundary detection to preserve table relationships.
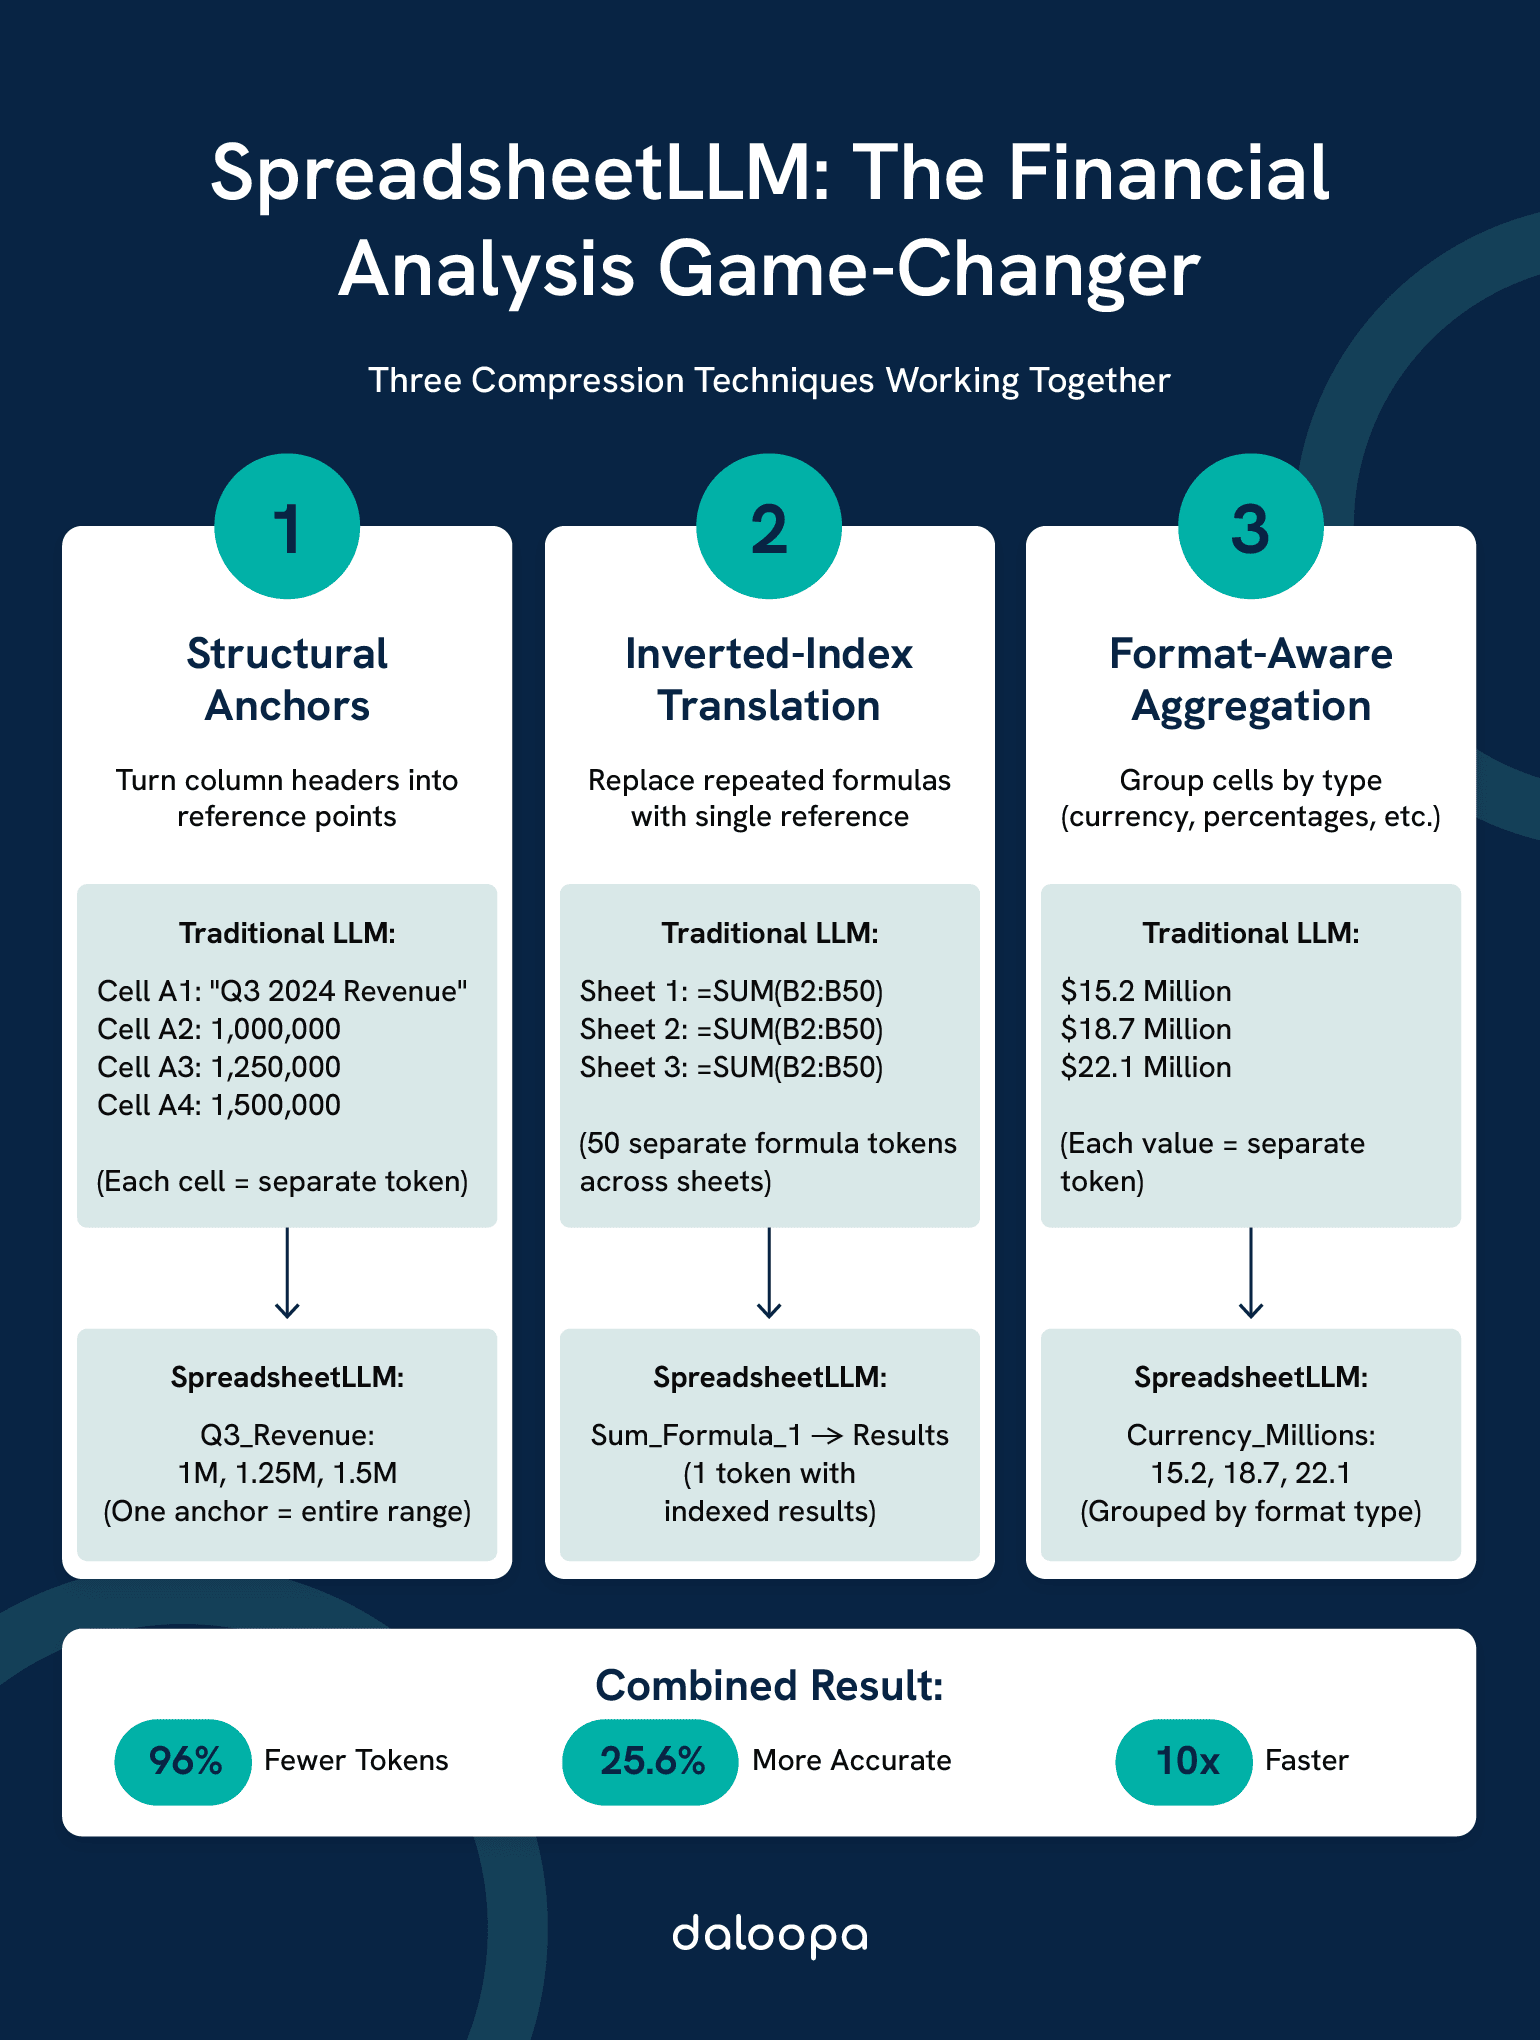
Table Detection and Boundary Recognition
Your financial statement contains overlapping data regions. The revenue table flows into operating expenses without clear borders. Subtotal rows look identical to data rows. Some tables nest inside others like Russian dolls.
SpreadsheetLLM’s boundary recognition uses three signals:
- Semantic discontinuity: When cell values shift from revenue figures to expense categories, the model detects the conceptual boundary even without visual formatting.
- Formula patterns: SUM() and SUBTOTAL() functions indicate table endpoints. The model learns that formulas aggregating upward usually mark table boundaries.
- Whitespace geometry: Empty rows and columns create natural borders. But the model distinguishes intentional separation from sparse data gaps.
Watch the detection algorithm process a complex P&L statement:
- Identifies “Revenue” as primary anchor
- Tracks numeric continuity down the column
- Detects formula break at “Total Revenue”
- Recognizes conceptual shift to “Operating Expenses”
- Maps table boundary between row 15 and 16
- Continues parsing with new context
Fine-tuned models achieve approximately 79% F1 score, surpassing the state-of-the-art by 13%¹. Non-standard formats still achieve strong performance, beating any alternative approach.
Common failure modes and solutions:
- Merged cells across tables: Decompose into atomic cells first
- Nested subtables: Recursive boundary detection
- Irregular spacing: Pattern learning from similar documents
With structure understood, the system can process complex analytical queries efficiently.
Query Processing and Financial Reasoning
Traditional LLMs fail at multi-step financial reasoning because they lose context between table hops. SpreadsheetLLM maintains semantic continuity through its compression framework.
Consider the query: “Calculate the three-year average EBITDA margin for each business segment, excluding one-time charges.”
Traditional LLM approach:
- Searches for “EBITDA” finds 47 instances across tables.
- Attempts to identify segments, confused by varying formats.
- Looks for one-time charges and misses footnote references.
- Calculates incorrectly due to misaligned data.
SpreadsheetLLM approach:
- Structural anchors immediately identify segment tables.
- Inverted index links EBITDA calculations across years.
- Format aggregation recognizes footnote markers.
- Compression preserves relationships for accurate calculation.
The system maintains three context layers:
- Local context: Immediate cell relationships and formulas
- Table context: Column headers, row labels, and subtotals
- Document context: Cross-references between tables and sheets
This hierarchical understanding enables complex reasoning:
Query: “What drove the year-over-year margin compression in the European segment?”
Processing:
- Locate European segment data (structural anchor)
- Extract margin calculations (inverted index)
- Compare periods (format aggregation)
- Identify variance drivers (semantic analysis)
Output: European margins declined 320 basis points primarily due to:
– Input cost inflation (180 bps impact)
– Currency headwinds (90 bps)
– Pricing pressure (50 bps)
For organizations seeking immediate implementation, Daloopa MCP provides pre-configured query processing optimized for financial analysis workflows.
The architecture’s elegance appears in how compression improves accuracy rather than degrading it.
The Business Impact of Accurate Spreadsheet Understanding
Beyond Extraction: Intelligent Analysis
SpreadsheetLLM doesn’t just read numbers, it understands financial relationships. This distinction separates data extraction from actual analysis.
A private equity associate analyzing a potential acquisition previously spent:
- 4 hours extracting historical financials
- 3 hours normalizing adjustments
- 2 hours building initial models
- 1 hour creating summary slides
With SpreadsheetLLM:
- 5 minutes for extraction and normalization
- 30 minutes refining the model with conversational inputs
- 15 minutes generating comprehensive outputs
The 10x productivity gain comes from eliminating mechanical work while preserving analytical judgment. The associate focuses on deal strategy, not data entry.
Real Analysis Examples:
- Working Capital Trends: “Analyze working capital efficiency over the last twelve quarters, highlighting seasonal patterns and calculating the cash conversion cycle for each period.” — The system extracts balance sheet items, calculates DSO, DPO, and inventory turns, identifies seasonal spikes in Q4, and presents findings with supporting data, all in seconds.
- Covenant Compliance: “Check all debt covenants in the credit agreement against current quarter actuals, flagging any within 10% of limits.” — SpreadsheetLLM parses legal documents, extracts covenant formulas, applies them to current financials, and produces a compliance dashboard with buffer analysis.
- Variance Analysis: “Compare actual results to budget and prior year, identifying top 5 variances by dollar and percentage impact.” — The framework processes multiple data sources simultaneously, aligns time periods, calculates variances, ranks by materiality, and explains drivers based on available data.
Private equity firms using AI for due diligence automation report saving hundreds of hours⁷ on document processing and analysis tasks.
Understanding relationships enables predictive insights beyond historical reporting.
Hidden Pattern Detection in Financial Data
Financial statements contain patterns invisible to cursory review but obvious to systematic analysis. SpreadsheetLLM surfaces these insights through comprehensive pattern matching.
Accounting Manipulation Detection:
The system identifies suspicious patterns suggesting earnings management:
- Receivables growing faster than revenue
- Declining cash flow despite rising earnings
- Unusual inventory buildups
- Aggressive depreciation changes
- Reserve releases boosting margins
Example alert: “Warning: Days sales outstanding increased from 45 to 67 days while revenue grew only 3%. Potential channel stuffing or collection issues.”
Relationship Mapping:
SpreadsheetLLM discovers non-obvious correlations:
- Marketing spend to revenue lag effects
- Seasonal working capital requirements
- Geographic segment interdependencies
- Product mix impact on margins
A hedge fund discovered their target company’s European margins inversely correlated with Asian revenue, revealing a hidden transfer pricing strategy that influenced their investment thesis.
Trend Extrapolation Example:
Beyond identifying patterns, the system projects likely outcomes:
Historical Pattern Detected:
– Q4 revenue consistently 35-40% of annual total
– September typically strongest month (18% of Q4)
– New product launches drive 15% increment
Projection for Current Year:
– Q4 revenue likely $287-295M
– September should see $51-53M
– New product contribution estimated at $43M
Anomaly Detection Framework:
The system flags outliers requiring investigation:
| Metric | Expected Range | Actual | Flag |
| Gross Margin | 42-45% | 41.8% | ⚠️ Below range |
| DSO | 40-50 days | 67 days | 🔴 Critical |
| Inventory Turns | 8-10x | 8.5x | ✅ Normal |
| CapEx/Revenue | 3-5% | 8.2% | 🔴 Critical |
These patterns become actionable intelligence for investment decisions.
Risk detection capabilities extend beyond simple ratio analysis to complex scenario modeling.
Risk Assessment and Compliance Automation
Regulatory compliance consumes thousands of analyst hours annually. SpreadsheetLLM automates the mechanical aspects while flagging areas requiring human judgment.
Automated Compliance Workflows:
SOX Testing:
- Extract key controls from documentation
- Test calculations against control definitions
- Flag exceptions and variances
- Generate audit-ready reports
Basel III Capital Calculations:
- Parse risk-weighted assets
- Calculate capital ratios
- Stress test under scenarios
- Produce regulatory submissions
SEC Filing Review:
- Cross-check numbers across documents
- Verify XBRL tagging accuracy
- Identify missing disclosures
- Flag inconsistent presentations
Risk Scoring Engine Example:
The system assigns risk scores based on multiple factors:
Company: TechCorp Industries
Overall Risk Score: 72/100 (ELEVATED)
Financial Health: 65/100
- Declining margins (-10 pts)
- Rising leverage (-15 pts)
- Strong cash position (+10 pts)
Accounting Quality: 58/100
- Aggressive revenue recognition (-20 pts)
- Frequent restatements (-15 pts)
- Clean audit opinions (+8 pts)
Market Position: 78/100
- Market share gains (+15 pts)
- Competitive threats (-5 pts)
- Strong brand value (+10 pts)
Key Risks Requiring Review:
- Covenant breach possible in Q3 if trends continue
- Accounts receivable aging deteriorating
- Customer concentration increasing (top 5 = 67% of revenue)
Scenario Analysis Automation:
SpreadsheetLLM processes multiple scenarios simultaneously:
| Base Case | Bull Case | Bear Case |
| Revenue: +5% | Revenue: +12% | Revenue: -3% |
| Margins: Flat | Margins: +100bps | Margins: -200bps |
| FCF: $250M | FCF: $400M | FCF: $100M |
| Debt/EBITDA: 3.2x | Debt/EBITDA: 2.5x | Debt/EBITDA: 4.5x |
| Covenant Breach: No | Covenant Breach: No | Covenant Breach: Q4 |
The system recalculates entire models under each scenario, identifying breaking points and sensitivities.
For firms requiring enterprise-grade compliance automation, Daloopa provides SOC 2 certified infrastructure with full audit trails.
Implementation success requires careful planning and systematic rollout.
Implementation Guide for Financial Institutions
Technical Architecture and Integration
SpreadsheetLLM deployment isn’t plug-and-play. Success requires thoughtful architecture decisions aligned with existing infrastructure.
Core Architecture Components:
- Data Sources
- Excel Files
- PDF Tables
- Databases
- Ingestion Layer
- Validation
- Cleaning
- Formatting
- Compression Engine
- SheetCompressor
- 96% Reduction
- Relationship Mapping
- LLM Processing
- Enterprise LLMs
- Financial Models
- Analysis Engine
- Output Layer
- Dashboards
- API Endpoints
- Excel Add-ins
Implementation Phases:
- Phase 1: Environment Setup (Week 1-2)
- Provision compute resources (minimum 32GB RAM, 8 CPU cores)
- Install dependencies (Python 3.9+, pandas, openpyxl)
- Configure API endpoints and authentication
- Establish data governance protocols
- Phase 2: Data Pipeline (Week 3-4)
- Build ingestion adapters for data sources
- Implement validation rules
- Create error handling workflows
- Test with sample documents
- Phase 3: Compression Layer (Week 5-6)
- Deploy SheetCompressor modules
- Tune parameters for document types
- Validate compression ratios
- Benchmark performance
- Phase 4: Integration (Week 7-8)
- Connect to LLM endpoints
- Build query interfaces
- Create output formatters
- Implement caching strategies
Performance Optimization Checklist:
- Batch processing for multiple documents
- Async operations for parallel analysis
- Redis caching for repeated queries
- CDN for static document storage
- Load balancing across LLM endpoints
- Circuit breakers for API failures
- Retry logic with exponential backoff
Security Architecture:
- Layer 1: Network Security
- VPN access only
- IP whitelisting
- DDoS protection
- Layer 2: Application Security
- OAuth 2.0 authentication
- Role-based access control
- API rate limiting
- Layer 3: Data Security
- AES-256 encryption at rest
- TLS 1.3 in transit
- Tokenization of sensitive data
- Layer 4: Compliance
- SOC 2 Type II certified
- GDPR compliant
- Audit logging
For accelerated deployment, Daloopa’s API provides production-ready infrastructure with built-in optimization and security.
Security concerns often gate adoption—address them proactively.
Security Considerations and Data Privacy
Financial data requires military-grade security. One breach destroys trust permanently.
Data Handling Protocols:
- Input Sanitization:
- Remove personally identifiable information (PII)
- Redact account numbers
- Hash customer identifiers
- Strip metadata
- Processing Isolation:
- Dedicated compute instances per client
- Memory encryption during processing
- No persistent storage of raw data
- Automatic purging after analysis
- Output Controls:
- Watermarking of generated documents
- Access logs for every query
- Version control with rollback
- Encryption of cached results
Compliance Framework:
| Regulation | Requirement | Implementation |
| GDPR | Right to deletion | 24-hour data purge policy |
| CCPA | Data minimization | Only process required fields |
| SOX | Audit trails | Immutable logs with timestamps |
| FINRA | Data retention | 7-year encrypted archives |
| Basel III | Model validation | Quarterly accuracy testing |
Zero-Trust Architecture:
Every component assumes breach:
- No implicit trust between services
- Continuous verification
- Least privilege access
- Microsegmentation
- Encrypted service mesh
Incident Response Plan:
- Detection (0-15 minutes)
- Automated anomaly alerts
- Manual investigation trigger
- Incident commander assigned
- Containment (15-60 minutes)
- Isolate affected systems
- Revoke compromised credentials
- Enable enhanced logging
- Eradication (1-4 hours)
- Identify root cause
- Remove threat vectors
- Patch vulnerabilities
- Recovery (4-24 hours)
- Restore from clean backups
- Verify system integrity
- Resume normal operations
- Lessons Learned (1-7 days)
- Post-mortem analysis
- Update security policies
- Implement improvements
Privacy-Preserving Techniques:
- Federated Learning:
- Model trains on distributed data
- Raw data never leaves premises
- Only model updates transmitted
- Differential privacy added
- Homomorphic Encryption:
- Compute on encrypted data
- Results remain encrypted
- Decryption only at destination
- No exposure during processing
Build team capabilities alongside technical infrastructure.
Building Internal Expertise
Technology without skilled operators creates expensive failures. Successful implementation requires systematic capability building.
Skill Development Matrix:
| Role | Current State | Target State | Training Path |
| Analysts | Excel experts | Prompt engineers | 40-hour certification |
| Developers | Python proficient | LLM architects | 80-hour bootcamp |
| Managers | AI-curious | AI-strategic | 20-hour workshop |
| Compliance | Risk-focused | Tech-enabled | 30-hour program |
Training Program Structure:
- Week 1: Foundations
- How LLMs process information
- Token economics and optimization
- SpreadsheetLLM architecture
- Hands-on with simple queries
- Week 2: Application
- Building complex queries
- Multi-step reasoning chains
- Error handling and validation
- Production workflow design
- Week 3: Advanced Topics
- Custom model fine-tuning
- Performance optimization
- Security best practices
- Compliance integration
- Week 4: Certification
- Practical assessments
- Real document analysis
- Troubleshooting exercises
- Presentation of findings
Center of Excellence Model:
AI CoE Structure:
- Leadership (1-2 people)
- Strategy alignment
- Budget management
- Technical Team (3-5 people)
- Architecture
- Development
- Operations
- Business Team (5-10 people)
- Use case identification
- Training delivery
- Change management
- Governance (2-3 people)
- Risk assessment
- Compliance monitoring
- Audit coordination
Success Metrics:
Track adoption and impact:
- Usage: Queries per day, unique users, document volume
- Quality: Accuracy rates, error frequency, validation scores
- Efficiency: Time saved, cost reduction, throughput increase
- Innovation: New use cases, process improvements, automation ideas
Common Pitfalls and Mitigations:
- “We’ll figure it out as we go”
Mitigation: Detailed project plan with clear milestones. - “IT can handle this alone”
Mitigation: Cross-functional team from day one. - “Let’s start with the hardest use case”
Mitigation: Begin with quick wins to build confidence. - “Training can wait until after deployment”
Mitigation: Train teams before systems go live. - “We don’t need external help”
Mitigation: Engage experts for accelerated learning.
Strong foundations enable powerful applications across the organization.
Cost-Benefit Analysis Framework
CFOs demand quantifiable ROI before approving AI investments. Build your business case with precision.
Total Cost of Ownership (TCO) Example:
Year 1 Costs:
– Software licenses: $50,000
– API usage (1M queries): $35,000
– Infrastructure: $25,000
– Training: $40,000
– Implementation services: $75,000
Total: $225,000
Ongoing Annual Costs:
– Software maintenance: $10,000
– API usage growth: $50,000
– Infrastructure scaling: $15,000
– Continuous training: $20,000
Total: $95,000
Quantifiable Benefits:
| Benefit Category | Calculation | Annual Value |
| Time Savings | 500 hours/month × $150/hour × 12 | $900,000 |
| Error Reduction | 50 errors/month × $5,000/error × 12 | $3,000,000 |
| Faster Decisions | 2 days faster × 20 decisions × $10,000/day | $400,000 |
| Opportunity Cost | 3 additional deals × $100,000 profit | $300,000 |
| Total Benefits | $4,600,000 |
ROI Calculation:
- Year 1 ROI: ($4,600,000 – $225,000) / $225,000 = 1,844%
- 5-Year NPV (10% discount): $13.2 million
- Payback Period: 0.6 months
Sensitivity Analysis:
| Scenario | Assumption Change | ROI Impact |
| Conservative | -50% benefits | 872% |
| Base Case | As calculated | 1,844% |
| Optimistic | +30% benefits | 2,457% |
| Worst Case | -70% benefits, +50% costs | 287% |
Even worst-case scenarios deliver strong positive returns.
Hidden Value Drivers:
Beyond direct ROI, consider:
- Competitive advantage from faster insights
- Risk mitigation through better compliance
- Talent retention by eliminating mundane work
- Strategic optionality from data accessibility
- Knowledge preservation as employees transition
Implementation Risk Matrix:
| Risk | Probability | Impact | Mitigation |
| Technical failure | Low | High | Phased rollout, extensive testing |
| User adoption | Medium | Medium | Change management, training |
| Data quality | Medium | High | Validation rules, cleansing |
| Vendor lock-in | Low | Medium | Open standards, portability |
| Regulatory change | Low | Low | Flexible architecture |
Organizations implementing SpreadsheetLLM report ROI within the first quarter, with benefits accelerating as adoption expands.
The Future of AI-Powered Financial Analysis
Beyond Spreadsheets: Multi-Modal Financial Intelligence
Spreadsheets represent just 40% of financial information. The next frontier integrates all data modalities into unified intelligence.
Emerging Capabilities:
- Chart and Graph Understanding: SpreadsheetLLM’s next iteration reads visual elements – parsing bar charts, interpreting trend lines, understanding pie chart distributions. A CFO’s investor presentation becomes fully analyzable, not just the underlying data.
- Narrative Analysis: Management discussion contains signals numbers miss. The system detects optimism shifts, identifies hedging language, flags discrepancy between tone and results.
- Document Intelligence: Contracts, agreements, and policies become queryable. “What are our payment terms with suppliers?” returns answers from 500 PDF contracts in seconds.
Example multi-modal analysis:
“Review the Q3 investor presentation and identify any discrepancies between the narrative, charts, and financial tables.”
The output: “Management highlighted cloud growth, but the numbers show deceleration. The chart on slide 14 obscures this by changing the Y-axis scale. Market reaction suggests investors noticed – stock dropped 3% despite earnings beat.”
Current State (Available Now):
- Table extraction with 79% F1 score accuracy³
- Basic chart data extraction
- Text analysis of narratives
6-Month Horizon:
- Chart trend analysis and anomaly detection
- Cross-reference between numbers and narratives
- Automated inconsistency flagging
2-Year Vision:
- Real-time processing during earnings calls
- Predictive modeling based on management tone
- Automated investment thesis validation
Organizations can prepare today by:
- Standardizing document formats
- Building clean data pipelines
- Training teams on prompt engineering
- Establishing baseline metrics for comparison
Specialization will drive the next leap in capability.
Domain-Specific Financial LLMs
Generic LLMs understand language. Financial LLMs understand EBITDA.
The difference appears in nuanced understanding. When you mention “adjustment,” a generic LLM thinks “modification.” A financial LLM understands “add-back for non-recurring expenses affecting EBITDA calculations.”
Performance Comparison:
| Task | Generic LLM | Financial LLM (Projected) | Improvement |
| Covenant calculation | Moderate accuracy | High accuracy | Significant |
| Merger model analysis | Basic understanding | Expert-level analysis | Substantial |
| Working capital forecast | General projections | Precise modeling | Notable |
| Regulatory filing review | Surface-level check | Deep compliance review | Major |
Building Internal Capabilities Roadmap:
- Phase 1 (Months 1-3): Collect and annotate internal documents
- Phase 2 (Months 4-6): Fine-tune base model on your data
- Phase 3 (Months 7-9): Validate against historical analyses
- Phase 4 (Months 10-12): Production deployment with guardrails
The competitive advantage: Your model understands your specific methodology, your unique adjustments, your proprietary frameworks.
Daloopa partners with firms building specialized models, providing the infrastructure and expertise to accelerate deployment.
Collaborative Human-AI Analysis
The fear: AI replaces analysts. The reality: AI amplifies analysts.
The most successful deployments treat SpreadsheetLLM as a senior analyst who never sleeps, never miscounts, but still needs human judgment for strategic decisions.
Adoption Curve Reality:
- Week 1-2: Skepticism – “This can’t understand our complex models”
- Week 3-4: Experimentation – “Let me try it on simple tasks”
- Week 5-8: Trust building – “Actually faster and accurate”
- Week 9-12: Integration – “Can’t imagine working without it”
- Week 13+: Innovation – “What if we used this for…”
Training Plan Template:
- Foundation (Day 1-2)
- Basic query construction
- Understanding compression benefits
- Security and compliance protocols
- Application (Day 3-5)
- Hands-on with real documents
- Building custom queries
- Interpreting results
- Advanced (Week 2)
- Complex multi-table analysis
- Model building through conversation
- Automation workflow design
Productivity Metrics from Successful Deployments:
- Junior analysts: Significant productivity gains in data gathering
- Senior analysts: Notable efficiency in complex analysis
- Directors: Faster decision-making with automated summaries
Common Resistance Points and Solutions:
- “I don’t trust AI with critical calculations”
Solution: Run parallel validation for first month, demonstrating high accuracy. - “This will make my job obsolete”
Solution: Demonstrate how automation eliminates mundane work, enabling focus on strategy. - “Our data is too complex/unique”
Solution: Start with simple use cases, gradually increase complexity. - “What about confidentiality?”
Solution: Show security architecture, compliance certifications, audit trails.
The future analyst: augmented, not replaced. Focusing on insight, not extraction. Adding judgment where machines provide facts.
The Bottom Line: Transform Your Financial Analysis Today
SpreadsheetLLM transforms an economic impossibility into operational reality. The 96% token reduction² isn’t just a technical achievement, it’s the unlock that makes LLM financial spreadsheet analysis viable at enterprise scale.
The three pillars stand proven:
- Accuracy: From baseline to 78.9% F1 score¹ for financial documents
- Cost: From $2,250 to $90 monthly for typical usage
- Scale: From 50 documents daily to 500+
Your Next Steps:
- Assess your current workflow: Calculate hours spent on manual extraction.
- Run a pilot program: Start with your most repetitive analysis task.
- Measure baseline metrics: Document current accuracy and time requirements.
- Implement incrementally: Begin with read-only analysis before automation.
- Scale systematically: Expand from one team to entire organization.
Ready to Transform Your Financial Analysis?
Start Your Implementation Journey:
- Explore Daloopa’s LLM integration for turnkey deployment
- Access pre-built models through Daloopa MCP
- Get started with our API documentation
Further Reading:
- The Pros and Cons of Using LLMs for Financial Analysis
- Financial Analyst Guide to Choosing the Right LLM
- Financial Statement Analysis with Large Language Models
- Can Large Language Models Analyze Financial Statements Well?
- Open Source Benchmark to Measure LLM Accuracy
The firms implementing these techniques today will outpace those waiting for perfect solutions tomorrow. The technology exists. The economics work. The only question: will you lead or follow in making financial spreadsheet analysis truly intelligent?
References
- Tian, Yuzhang, et al. “SpreadsheetLLM: Encoding Spreadsheets for Large Language Models.” arXiv, 25 July 2025, https://arxiv.org/html/2407.09025v1.
- “How to Turbocharge LLMs for Spreadsheet Tasks.” TechTalks, 29 July 2024, https://bdtechtalks.com/2024/07/29/microsoft-spreadsheetllm/.
- “‘SpreadsheetLLM’ Finally Lets LLMs Master Spreadsheets Better Than Ever.” Into AI, 15 Sept. 2024, https://intoai.pub/p/spreadsheetllm-finally-lets-llms.
- Rastogi, Ritvik. “Papers Explained 271: Spreadsheet LLM.” Medium, 12 Dec. 2024, https://ritvik19.medium.com/papers-explained-271-spreadsheet-llm-25b9d70f06e3.
- “Understand Sparsity and Density.” Anaplan Technical Documentation, https://help.anaplan.com/616ee341-8a5f-4718-8c90-c82e34eca86c-Understand-sparsity-and-density.
- “SpreadsheetLLM: Microsoft’s Breakthrough in AI-powered Spreadsheet Analysis.” UnfoldAI, 17 July 2024, https://unfoldai.com/spreadsheetllm/.
- “An Introduction to Financial Statement Analysis With AI [2025].” V7 Labs, https://www.v7labs.com/blog/financial-statement-analysis-with-ai-guide.


