
Accessing company historical financial data can be crucial for making well-informed investment decisions and understanding market trends. To access this data, we need to start by reviewing publicly available financial statements from reliable databases or company websites. These financial statements usually include income statements, balance sheets, and cash flow statements, providing comprehensive insights into a company’s performance over time.
3 Ways to Accessing Company Historical and Fundamental Data in Excel
One of your core responsibilities of any analyst is analyzing company data, and Excel is an indispensable tool for this purpose. These are the primary methods to access and manage historical and fundamental data within Excel. Although the first one is an option you’ll most likely spend most of your time leveraging third party add-ins and external data sources.
1) Excel Built-in Features
Excel offers robust built-in features for accessing stock and fundamental data. Using the Stock Data Type, you can quickly pull in real-time and historical data by simply entering the company name or ticker symbol. This feature allows you to access key metrics like market capitalization, P/E ratios, and historical prices without leaving Excel. For more advanced needs, the built in Power Query is also useful for importing and transforming data from the web or other sources, giving you flexibility in how you gather and manage your data.
2) Third-Party Add-Ins
For comprehensive and reliable data, third-party add-ins such as the Bloomberg Excel Add-In or Daloopa are essential. These add-ins provide access to extensive datasets directly within Excel, covering everything from detailed financial statements to historical price data. They streamline the process of gathering data and ensure you have the latest information at your fingertips.
3) External Data Sources
For those of you comfortable with APIs and external data feeds, leveraging APIs from providers like Alpha Vantage or Polygon can be highly effective. These APIs allow you to pull in a wide range of financial data directly into Excel through web service functions, enabling real-time updates and customized data retrieval.
Additionally, downloading CSV files from trusted financial websites like Yahoo Finance is a straightforward method to access historical data. You can easily import these files into Excel and use built-in tools to clean and analyze the data.
In theory all analysts can utilize resources like the Securities and Exchange Commission (SEC) database, which houses extensive records of company filings. Analytical tools and platforms offer additional support by compiling this information and providing user-friendly interfaces to analyze financial trends and investment opportunities effectively.
Exploring diverse types of financial data is vital. This includes considering global data and different industry classifications to get a comprehensive picture of the economic landscape. By leveraging these resources, we gain a deeper understanding of the company’s historical financial performance and make better investment decisions.
Understanding The 7 Main Sources of Historical Financial Data on Companies
While there are a few core courses of data, in practice there are thousands of potential data points and sources analysts can use to construct financial models.
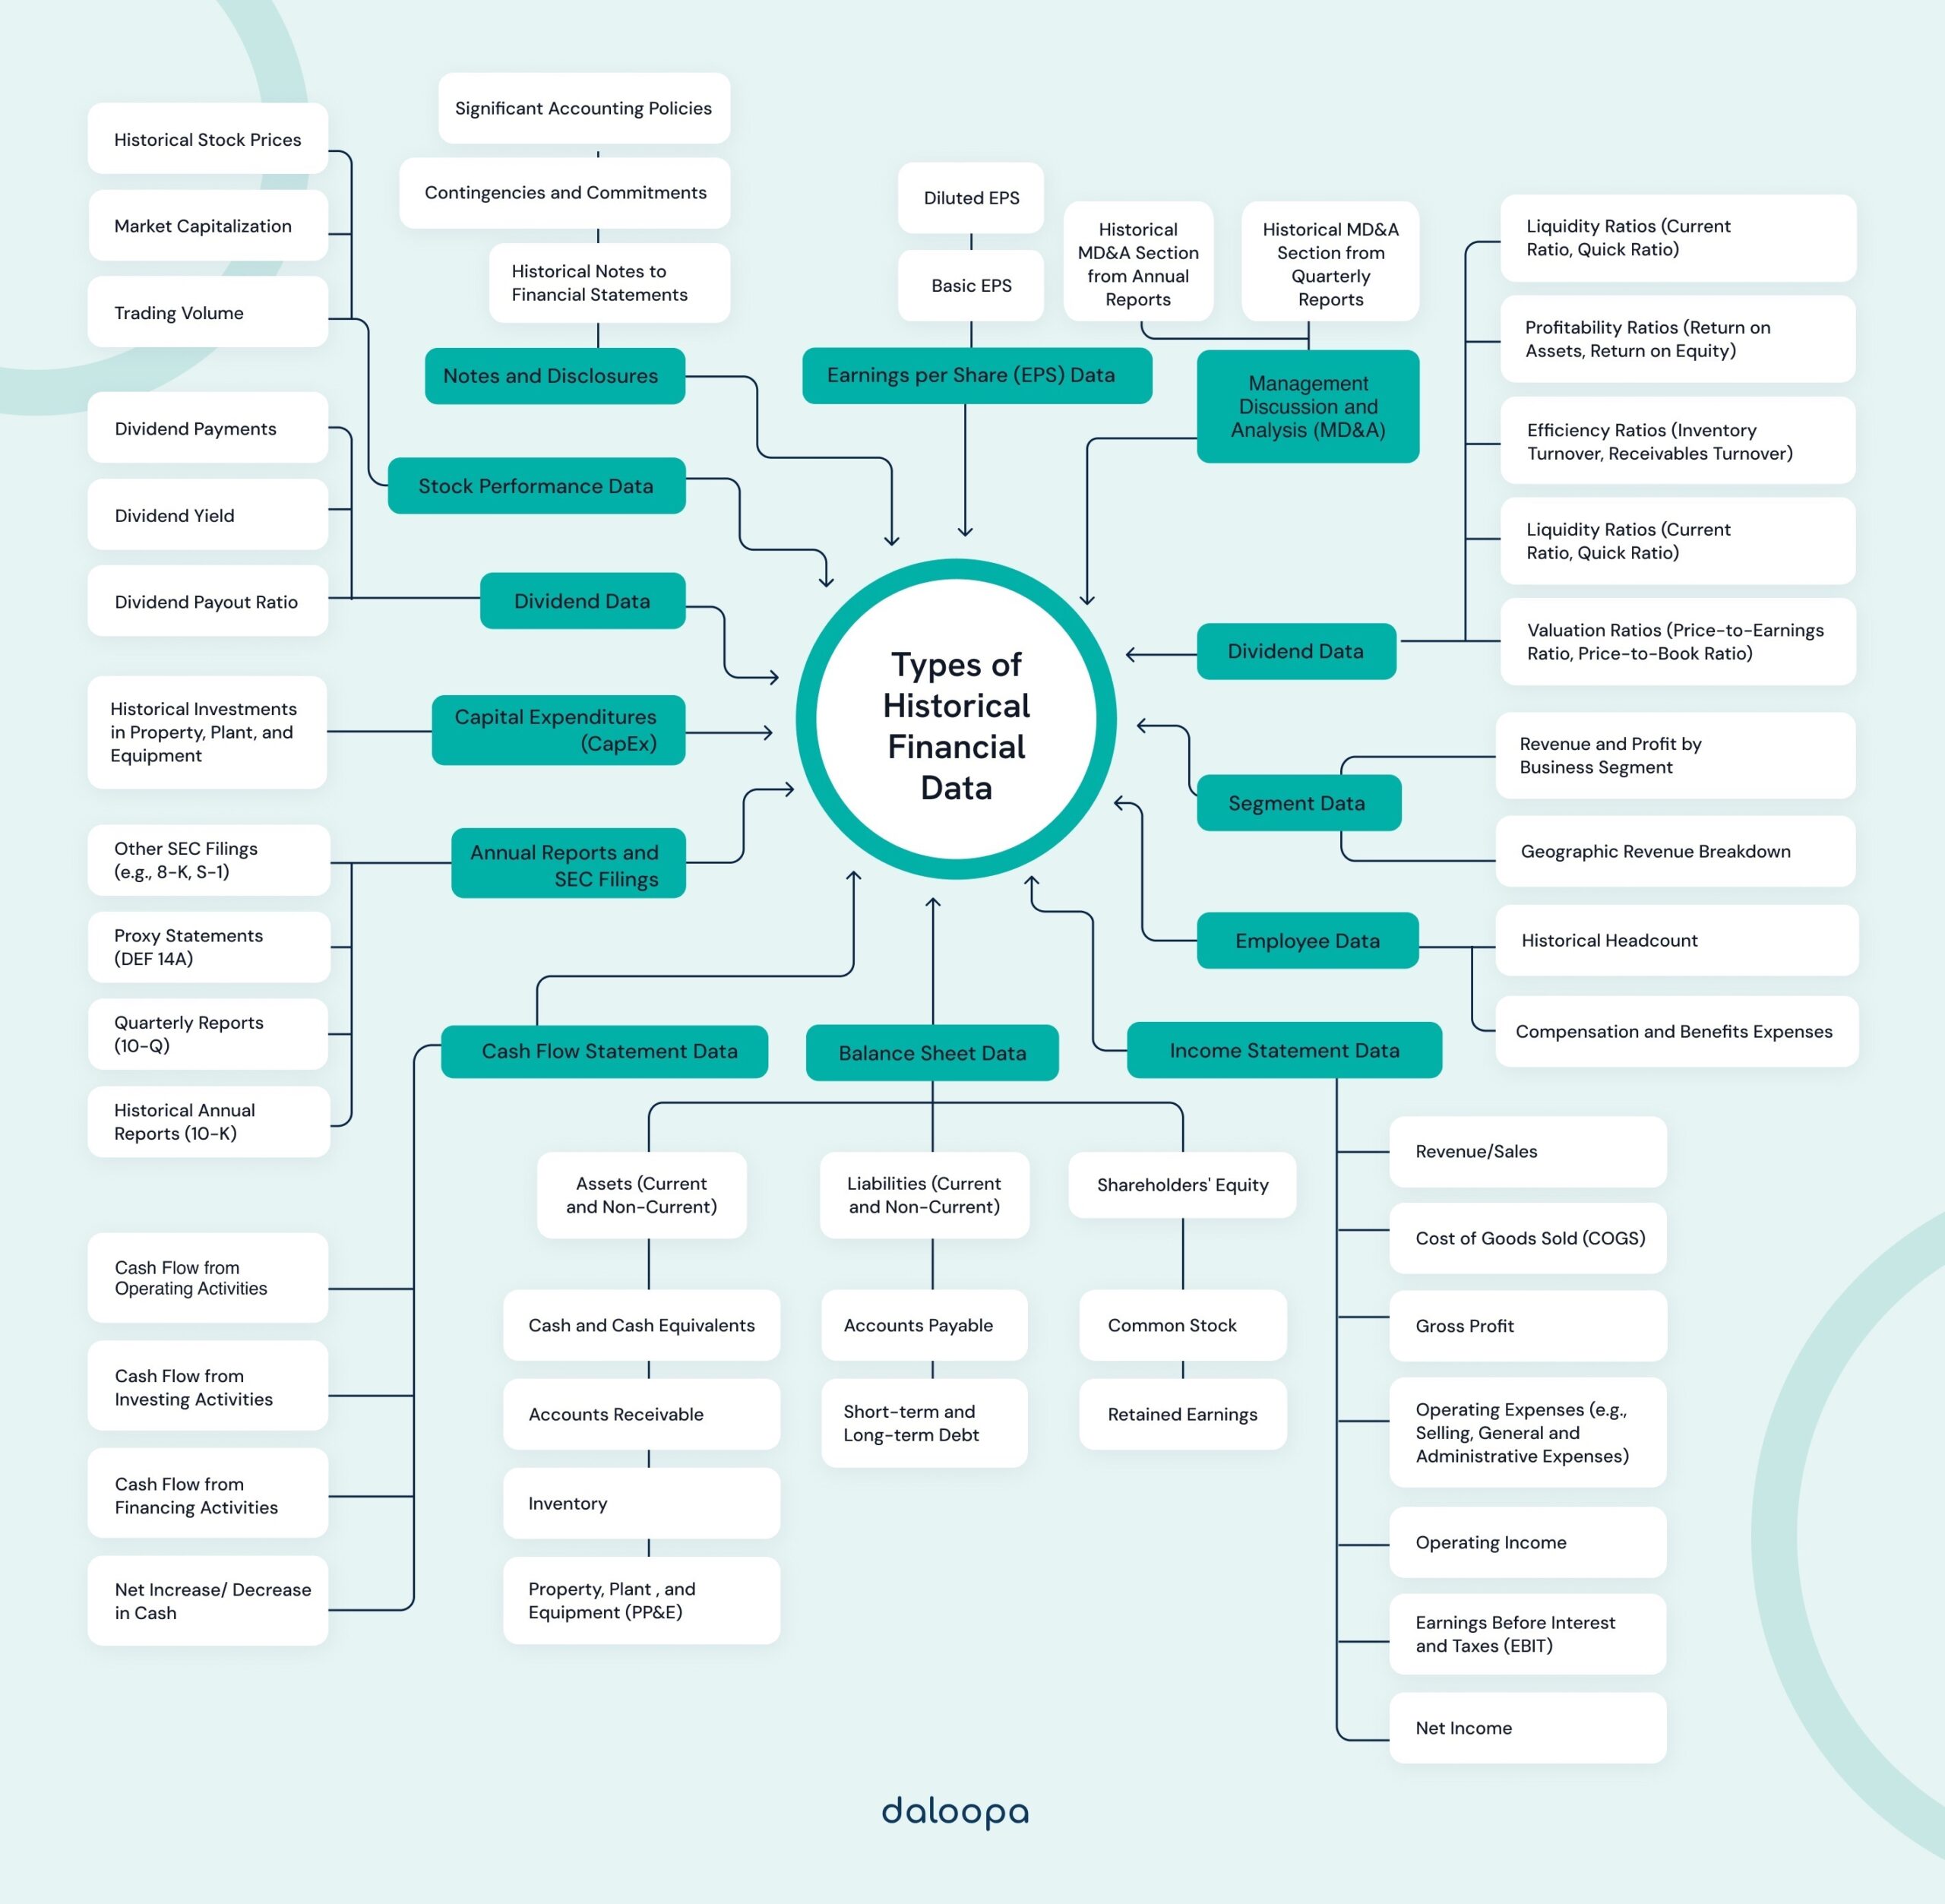
No matter what your approach is for construction models, you’ll most likely rely on some combination of the below for daily projects:
Income Statement Data:
- Revenue/Sales
- Cost of Goods Sold (COGS)
- Gross Profit
- Operating Expenses (e.g., Selling, General and Administrative Expenses)
- Operating Income
- Earnings Before Interest and Taxes (EBIT)
- Net Income
Balance Sheet Data:
- Assets (Current and Non-Current)
- Cash and Cash Equivalents
- Accounts Receivable
- Inventory
- Property, Plant, and Equipment (PP&E)
- Liabilities (Current and Non-Current)
- Accounts Payable
- Short-term and Long-term Debt
- Shareholders’ Equity
- Common Stock
- Retained Earnings
Cash Flow Statement Data:
- Cash Flow from Operating Activities
- Cash Flow from Investing Activities
- Cash Flow from Financing Activities
- Net Increase/Decrease in Cash
Earnings per Share (EPS) Data:
- Basic EPS
- Diluted EPS
Dividend Data:
- Dividend Payments
- Dividend Yield
- Dividend Payout Ratio
Ratios and Metrics:
- Liquidity Ratios (e.g. Current Ratio, Quick Ratio)
- Profitability Ratios (e.g. Return on Assets, Return on Equity)
- Efficiency Ratios (e.g. Inventory Turnover, Receivables Turnover)
- Leverage Ratios (e.g. Debt-to-Equity Ratio)
- Valuation Ratios (e.g. Price-to-Earnings Ratio, Price-to-Book Ratio)
Stock Performance Data:
- Historical Stock Prices
- Market Capitalization
- Trading Volume
Segment Data:
- Revenue and Profit by Business Segment
- Geographic Revenue Breakdown
Capital Expenditures (CapEx):
- Historical Investments in Property, Plant, and Equipment
Employee Data:
- Historical Headcount
- Compensation and Benefits Expenses
Notes and Disclosures:
- Historical Notes to Financial Statements
- Contingencies and Commitments
- Significant Accounting Policies
Annual Reports and SEC Filings:
- Historical Annual Reports (10-K)
- Quarterly Reports (10-Q)
- Proxy Statements (DEF 14A)
- Other SEC Filings (e.g., 8-K, S-1)
Management Discussion and Analysis (MD&A):
- Historical MD&A Sections from Annual and Quarterly Reports
Broadly speaking, all of this information comes from seven core buckets.
Source 1: Company Financial Statements
Understanding financial statements helps us analyze a company’s financial performance. Key reports include the income statement, balance sheet, and cash flow statement. Each gives us specific insights into various aspects of the business.
Income Statement
The income statement, also called the profit and loss statement, shows a company’s revenues, expenses, and profits over a specific period. It tells us how much money a company made or lost.
Key Parts:
- Revenue: Total earnings from goods or services sold.
- Expenses: Costs incurred to produce revenue.
- Net Income: Profit after all expenses are subtracted from revenue.
We commonly look at metrics like gross profit and operating expenses to assess financial health. This statement is crucial for investors and analysts in evaluating profitability trends.
Balance Sheet
The balance sheet provides a snapshot of a company’s financial position at a specific point in time. It lists assets, liabilities, and shareholders’ equity.
Key Parts:
- Assets: Resources owned by the company, such as cash, inventory, and property.
- Liabilities: Obligations like loans and accounts payable.
- Shareholders’ Equity: The residual interest in the assets after deducting liabilities.
Examining the balance sheet helps us understand a company’s assets and how they are financed. It is vital for evaluating financial stability and liquidity. Analysts often use ratios like the current ratio and debt-to-equity ratio to assess risks.
Cash Flow Statement
The cash flow statement reveals how cash is generated and used over a period. It is divided into operating, investing, and financing activities.
Key Parts:
- Operating Activities: Cash earned or spent in core business operations.
- Investing Activities: Money used for acquiring or selling assets.
- Financing Activities: Funds raised or returned to shareholders.
This statement is essential for understanding a company’s ability to generate cash, pay debts, and support growth. Investors and analysts consider free cash flow to gauge financial flexibility and operational efficiency.
Accessing these statements allows us to make informed decisions based on a company’s financial health and performance.
Source 2: Securities and Exchange Commission (SEC) Data & Public Disclosures
The Securities and Exchange Commission (SEC) plays a critical role in ensuring transparency and fairness in the financial markets. We will explore how the SEC regulates companies, how to access essential filing documents, and the tools available for researching historical financial data.
SEC Filings Overview
The SEC requires publicly traded companies in the United States to submit various financial documents. These filings help investors stay informed about the financial health and operating performance of companies. Key SEC filings include the 10-K, which provides annual financial reports, and the 10-Q, which gives quarterly updates.
These documents must be accurate and are subject to strict rules. The SEC also mandates filings like the S-1, which is used for companies planning to go public. Another crucial form is the 8-K, which reports unscheduled material events or corporate changes.
Accessing SEC Filings
Investors and analysts can access these filings through multiple avenues. Most companies host their recent SEC filings on their official websites under investor relations sections. However, for a comprehensive collection, the SEC’s EDGAR database is the go-to resource.
EDGAR, which stands for Electronic Data Gathering, Analysis, and Retrieval, ensures that all submitted filings are publicly accessible. This access allows us to research a company’s historical performance and understand key financial trends over time. Various financial news websites also pull data from EDGAR to provide snapshots of these documents.
SEC’s EDGAR Database
The SEC’s EDGAR database is an essential tool for anyone looking to access historical financial data. EDGAR houses millions of filings, making it a comprehensive repository for financial documents dating back many decades.
To use EDGAR, we can start by visiting the SEC’s website and navigating to the EDGAR search tool. Users can search by company name, ticker symbol, or form type. For detailed analysis, EDGAR supports XBRL (eXtensible Business Reporting Language), enabling users to download data in a structured format for deeper analysis.
Source 3: Benchmarks, Historical Financial Data, and Investment Decisions
Analyzing historical financial data helps us make informed investment decisions by revealing trends and patterns. We can evaluate past stock performance and use valuation metrics to guide our choices.
Importance of Data History
Historical financial data gives us a detailed view of a company’s financial health over time. By examining data such as revenue, profit margins, and cash flow, we can identify trends that might suggest future performance.
For example, consistent revenue growth over several years typically indicates a stable company. Data history is particularly useful for fundamental analysis which involves looking at a company’s financial statements to determine its fair market value. Knowing past performance helps us understand how a company reacts in different market conditions and economic cycles. This can help us predict its likely performance in the future.
Evaluating Stock Performance
When we look at a company’s historical stock prices, we gain insight into how the market has valued that company over time. This information allows us to compare current stock prices with past prices to identify undervalued or overvalued stocks.
Using valuation metrics like the price-to-earnings (P/E) ratio and dividend yield, we can assess if a stock is priced fairly. Stock analysis involves comparing a company’s historical performance against industry standards and competitors.
For example, a company with a consistently low P/E ratio compared to its industry peers might be undervalued. By considering past performance, we make better investment decisions based on factual, historical evidence rather than purely speculative information.
Source 4: Analytical Tools and Platforms
Selecting the right analytical tools and platforms is crucial for accessing and analyzing historical financial data effectively. In this section, we will cover essential resources including stock screeners, financial modeling software, and APIs for data retrieval. These tools are essential for creating comprehensive financial analyses.
Stock Screeners and Custom Dashboards
Stock screeners help us filter through vast amounts of financial data to find stocks that meet specific criteria. Many tools offer powerful screeners with customizable dashboards. These platforms let us create tailored views to monitor financial metrics and trends.
Custom dashboards are key for visualizing data. They allow us to set up alerts, track watchlists, and generate reports. We can integrate various widgets and tools to make informed decisions quickly. The flexibility provided by these dashboards ensures that we stay on top of market movements and financial performance indicators.
Financial Modeling and Analysis Software
For in-depth financial analysis, specialized software is indispensable. Applications such as Bloomberg provide comprehensive solutions for financial modeling. These platforms offer tools for building detailed financial models, performing scenario analysis, and valuing companies.
Financial modeling software helps us forecast future performance based on historical data. These tools also support sensitivity analysis, letting us see how changes in assumptions impact projections. Access to real-time and historical data in one place simplifies our workflow, reducing the risk of errors and improving the accuracy of our financial analyses.
APIs for Data Retrieval
APIs (Application Programming Interfaces) are crucial for retrieving historical financial data programmatically. Platforms like Yahoo Finance and Koyfin provide robust APIs that enable us to access a wide range of financial datasets efficiently. These APIs support data extraction, allowing for seamless integration with our analytical tools and software.
Using APIs, we can automate the retrieval of financial data, ensuring that we always have the latest information for our analysis. They also enable us to pull data at scale, which is particularly useful for backtesting investment strategies and conducting large-scale financial studies. APIs streamline the data gathering process, freeing up time for deeper analysis and insights.
You can also avoid financial APIs completely and leverage solutions like those offered by Daloopa to get financial information and instant updates directly in your current models.
Source 5: Industry Classification and Market Segmentation
Understanding how industries are classified and segmented is crucial to accessing and analyzing company historical financial data. We use specific systems to categorize industries and methods to analyze market trends and behaviors accurately.
Standard Industrial Classification (SIC)
The Standard Industrial Classification (SIC) system is essential for categorizing industries. SIC codes are numerical systems that segment companies into specific industry groups based on their primary business activities. These codes help in organizing data, conducting economic analysis, and facilitating comparisons across different industries.
SIC codes are widely recognized and used by government agencies, researchers, and businesses. For example, a company classified under SIC code 6021 would be identified as a national commercial bank. The SCP system’s consistency makes it easier for us to access historical financial data, compare performance, and perform other analyses.
Understanding and using SIC codes can streamline the data acquisition process, ensuring we accurately categorize companies and retrieve relevant historical data. This system’s structure enhances the efficiency of our financial data research.
Market Trends Analysis
Market trends analysis involves examining historical and current data to predict future market movements. This analysis helps in identifying patterns, measuring company performance, and making informed business decisions. We analyze factors like consumer behavior, economic indicators, and industry developments.
This process often includes market segmentation, where we divide a market into distinct groups of potential customers. By using methods like mixture models and data mining, we can identify patterns and trends that inform marketing strategies and business decisions. For instance, integrating market segmentation with stock movements can provide insights into how different segments react to market changes.
In this analysis, past performance and trends are essential for forecasting. By understanding which segments are growing or declining, we can better access and evaluate company historical financial data and make well-informed decisions. Quality market trends analysis combines quantitative data with industry knowledge to offer precise insights.
Source 6: Diverse Types of Financial Data
Understanding the various types of financial data is crucial. This knowledge helps us make informed decisions and better analyze market conditions.
Equities, Bonds, and Commodities
Equities represent ownership in a company. They provide returns through dividends and capital gains. Accessing historical equities data often involves using financial databases or market analysis platforms.
Bonds are debt instruments issued by entities like governments and corporations. Investors earn interest over time. Historical bond data helps us understand interest rate trends and the issuer’s creditworthiness.
Commodities are physical goods like gold, oil, and agricultural products. They are traded on commodity exchanges. Historical commodities data can be accessed via market reports and trading platforms.
Futures, Currencies, and Energy Data
Futures contracts obligate the buyer to purchase an asset at a predetermined future date and price. These contracts cover commodities, indices, and financial instruments. Historical futures data provides insights into price trends and market volatility.
Currencies or forex data involve the exchange rates between different currencies. This data is crucial for international trade and investment. We can get historical currency data from financial institutions and trading platforms.
Energy data includes information on oil, gas, and electricity markets. Energy prices influence economic conditions globally. Historical energy data can be accessed through industry reports and specialized databases.
Source 7: Global Financial Data Considerations
When accessing global financial data, it is crucial to consider regional regulations and the availability of data from various non-US markets. We will discuss how to access data for non-US companies and focus on specifics for key regions such as Europe, the UK, and India.
Accessing Data for Non-US Companies
Global financial data can be accessed through various platforms and databases. For publicly traded companies, stock exchanges and financial databases provide detailed historical data. Bloomberg, Reuters, and similar services offer comprehensive financial data for both public and private companies worldwide.
For private companies, data might be harder to obtain. Organizations like the European Private Equity and Venture Capital Association provide resources for private sector financials. In the UK, Companies House is a critical source for accessing the financial records of private enterprises.
Regional Focus: Europe, UK, and India
Europe: European companies are governed by strict regulations ensuring financial transparency. The European Securities and Markets Authority (ESMA) maintains a database of financial reports for publicly traded companies. This makes it easier to track historical data and trends.
United Kingdom: The UK requires all companies, both public and private, to submit annual financial reports to Companies House. Investors and researchers can access these records to gain insights into a company’s financial health.
India: India’s financial regulations require publicly traded companies to disclose their financials to the Securities and Exchange Board of India (SEBI). SEBI’s database is a valuable resource for accessing financial reports. For private companies, information might be available through business registries and private data providers.
Experience Daloopa for Free: Avoid Clunky Software & Traditional Financial Data APIs
Our AI Modeling Copilot pairs with your current workflows and gives you the deepest, most accurate, and auditable set of public company historicals to initiate coverage in your preferred formatting and update your existing models faster to cover more companies every quarter
Sample our data with a free account to better understand how Verifiable Data Scrubbing (“VDS”) looks and how it can fit into your investment process. Or use Daloopa Plus which enables analysts to instantly update key data points for companies reporting on the same day, allowing for immediate prioritization of companies and faster prep for the earnings calls.


